Institutional Intelligence.
Instant Credibility.
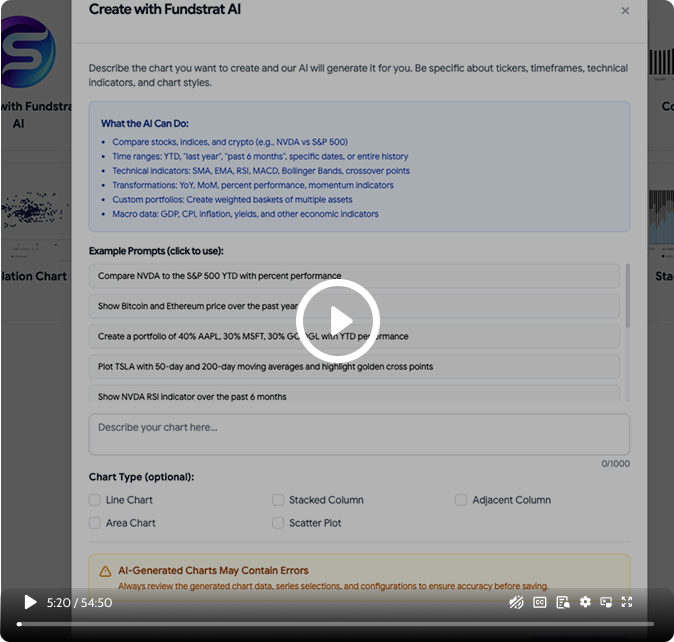
Get Tom Lee's, Mark Newton's, and Ken Xuan's market annotations baked directly into your charts—or toggle them off and write your own.
Stop explaining what the charts mean. Let Fundstrat's analysts do it for you. Every chart can include expert annotations highlighting key trends, support/resistance levels, and market context—giving your clients Wall Street-grade insights under your brand.
Charts Show Data. Annotations
Show Insight.
Clients Don't Know What
They're Looking At
You send a chart showing the S&P 500 with moving averages. Your client stares at it. "What am I supposed to see here?" They don't have your expertise.
You're Always Explaining
the Same Things
Every client call turns into chart interpretation 101. "This line here means support." "That spike was the Fed announcement." You're spending hours being a translator.
No Differentiation from
Generic Charts
Anyone can pull a chart from Bloomberg or FRED. What makes yours special? Without expert commentary, you're just another advisor with data.
Wall Street's Best Analysts.
Working for You.
Fundstrat Annotations turn every chart into a teaching moment. Key levels highlighted. Trend explanations. Historical context. All written by the analysts institutions pay six figures to access—now available to you and your clients.
Expert
Commentary
Tom Lee, Mark Newton, Ken Xuan, and the Fundstrat team annotate charts with institutional-grade insights. You get their brain power on every chart.
Always
Optional
Don't want annotations? Toggle them off. Want to add your own? Easy. Mix Fundstrat's insights with yours. Full control.
Updated
Continuously
As markets evolve, annotations evolve. New support levels. Changed trends. Updated outlook. Annotations refresh with the data.
Your Brand,
Their Brains
Clients see your logo, not Fundstrat's. The annotations elevate your credibility—they think you wrote them (and you can if you want).
The Team Behind Your Insights
You're not getting generic AI-generated commentary. These are real annotations from the analysts who've been right when others were wrong

Tom Lee
Head of Research & Managing Partner
25+ years of market strategy. Ranked #1 by Institutional Investor.
What Tom Annotates
- - Market regime analysis
- - Support/resistance levels based on historical patterns
- - Bull/bear case frameworks
- - Macro-equity relationships
- - Fed policy implications for markets
Annotation Style
Strategic, big-picture, risk/reward focused

Mark Newton
Head of Technical Strategy
25+ years of technical analysis. Former Morgan Stanley & Diamondback Capital.
What Mark Annotates
- - Chart patterns and formations
- - Fibonacci levels and retracements
- - Trend lines and channels
- - Volume analysis
- - Momentum indicators
- - Support/resistance zones
Annotation Style
Precise, technical, chart-pattern focused

Ken Xuan "Tireless Ken"
Head of Data Science
Columbia MS Operations Research. Proprietary model architect.
What Ken Annotates
- - Quantitative model signals
- - Statistical relationships and correlations
- - Regime probability indicators
- - Data anomalies and outliers
- - Forward return expectations based on historical data
Annotation Style
Data-driven, probabilistic, model-based

Sean Farrell
Head of Digital Assets
Crypto and digital asset strategy. Bridging traditional and digital markets.
What Sean Annotates
- - Bitcoin and crypto market analysis
- - On-chain metrics interpretation
- - Crypto/traditional market correlations
- - Digital asset flow trends
- - Regulatory impact analysis
Annotation Style
Forward-looking, cross-market, narrative-driven
Three Ways to Use Annotations
Pure Fundstrat Annotations
Use Case
You want institutional insights without doing the work.
How It Works
- - Browse annotated chart library
- - Select chart with Fundstrat annotations already applied
- - Annotations are visible by default
- - Add to chartbook or export directly
- - Your brand on top, Fundstrat's insights inside
Best For
Advisors who want to leverage expert analysis without creating their own commentary.

Hybrid (Fundstrat + Your Custom Annotations)
Use Case
You want Fundstrat's foundation plus your specific client context.
How It Works
- - Start with Fundstrat's annotations
- - Add your own callouts, arrows, and commentary
- - Mix expert analysis with personalized insights
- - Toggle between showing both or just yours
Best For
Advisors who want to leverage expert analysis without creating their own commentary.
Example
- - Fundstrat annotation: "Key support at 4,200 based on 2022-2023 consolidation"
- - Your annotation: "This aligns with our portfolio's re-entry strategy discussed in Q3"
Custom Only (Hide Fundstrat, Write Your Own)
Use Case
You want the data but prefer to provide all commentary yourself.
How It Works
- - Start with any chart from library
- - Toggle Fundstrat annotations OFF
- - Create your own annotations from scratch
- - Use annotation tools: text boxes, arrows, highlights
- - Full creative control
Best For
Advisors with strong proprietary views who want complete ownership of the narrative.
Professional Annotation Tools
at Your Fingertips
Text Callouts & Labels
Add explanatory text anywhere on the chart. Formatted automatically to match your brand.
Arrows & Directional
Indicators
Point to specific data points, trends, or levels. Multiple styles available.
Highlight Boxes & Zones
Draw attention to specific periods or ranges. Perfect for recession markers or volatility events.
Trend Lines &
Support/Resistance
Draw lines connecting highs/lows or marking key levels. Snaps to price points automatically.
Shape Tools
Circles, rectangles, brackets—emphasize patterns or clusters.
Rich Text Blocks
Add longer commentary with formatting. Perfect for context paragraphs or disclaimers.
Layer Management
Control which annotations appear. Stack Fundstrat's, yours, and chart elements in any order.
Annotation Presets
Save your annotation styles as templates. One-click application to future charts
See How Different RIAs Use
Annotations
Client Quarterly Review
Scenario:
Client-facing RIA preparing Q1 2026 review for 150 clients.
Fundstrat's Annotation
Q1 strength driven by AI earnings momentum and Fed pause expectations. Key resistance at 5,500 from 2024 highs.
Advisor's Added Annotation
Your portfolio participated 85% in this upside due to our tech overweight discussed in December.
Result
Client sees both expert market context and personal portfolio relevance.
Investment Committee Deep-Dive
Scenario:
Research-driven RIA presenting regime analysis to investment committee.
Fundstrat's Annotation
Historical pattern shows equities bottom 6-9 months before Fed pivot. Current setup similar to 1995, 2019.
Advisor's Added Annotation
Suggests Q2-Q3 entry window for adding equity exposure to balanced portfolios.
Result:
Committee sees institutional research backing tactical recommendations.
Social Media Content
Scenario:
Growth-oriented RIA creating LinkedIn post about market psychology.
Fundstrat's Annotation
Historically, VIX spikes above 25 followed by avg 12% gains over next 12 months (80% win rate, n=23).
Advisor's Custom Annotation
Fear creates opportunity. Our clients stayed invested through the last 3 spikes—and captured the rebounds.
Result:
Data-driven social post with institutional backing + personal narrative.
Technical Analysis Update
Scenario:
Content-led RIA writing weekly technical newsletter.
Fundstrat's Annotation
Broke above descending channel resistance at 17,800. Next target 18,400 (61.8% Fib retracement). Stop loss 17,200.
Advisor's Added Annotation
Our growth portfolio added tech exposure at 17,600 breakout per this signal.
Result:
Professional technical analysis with actionable portfolio implications.
Client Education Piece
Scenario:
Client-facing RIA explaining market cycles to new clients.
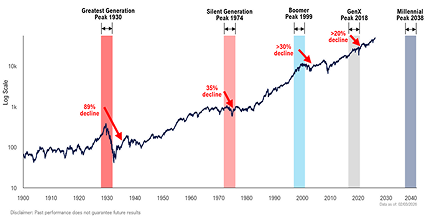
Fundstrat's Annotation
Average bull market lasts 5.5 years with 180% return. Bear markets average 11 months, -35%. Current cycle started Oct 2022.
Advisor's Custom Annotation
This is why we focus on time IN the market, not timing the market. Stay invested through cycles.
Result:
Educational chart that builds client confidence and understanding.
Your Rules. Your Brand.
Your Choice.
Annotation Visibility Controls
Toggle Individual Annotations
- - Show/hide specific callouts
- - Keep some Fundstrat annotations, hide others
- - Mix and match as needed
Advisor's Added Annotation
- - One-click to show/hide all Fundstrat annotations
- - Useful for creating multiple versions of same chart
Client-Specific Views
- - Create different annotation sets for different audiences
- - Institutional clients get detailed analysis
- - Retail clients get simplified explanations
Annotation Visibility Controls
Color Coding
- - Fundstrat annotations: Choose display color (default blue)
- - Your annotations: Use your brand colors
- - Differentiate sources visually
Typography
- - Match annotation fonts to your brand guidelines
- - Control size, weight, and style
- - Ensure readability across export formats
Logo Integration
- - Add your logo to annotated charts
- - Position: corner, watermark, or header
- - Size and opacity control
Export Options
Include/Exclude Annotations
- - Export with annotations for client-facing materials
- - Export clean (no annotations) for presentations where you'll explain verbally
- - Export with only your annotations (hide Fundstrat's)
Format Optimization
- - PDF: High-res, locked annotations
- - PPT: Editable text boxes (if desired)
- - Web: Interactive hover annotations (coming soon)
- - Images: Baked-in annotations for social media
Annotations Build Trust.
Data Alone Doesn't.
Perceived Expertise
The Problem
Clients can't evaluate your analytical skills by looking at a chart. They don't know if you're interpreting it correctly.
The Solution
Annotations demonstrate thought process. "This is what I see. This is why it matters. This is what we should do.
The Result
Client thinks: "My advisor really understands markets.
Proactive Communication
The Problem
Without annotations, clients wait for you to explain charts. They feel in the dark until your next call.
The Solution
Annotated charts communicate 24/7. Clients see your insights immediately, asynchronously.
The Result
I don't have to wonder what my advisor thinks—it's right here.
Institutional Credibility
The Problem
Independent RIAs compete with wirehouse brands that have "research departments.
The Solution
Fundstrat annotations give you institutional-grade analysis without the overhead.
The Result
Client thinks: "My advisor has access to the same insights as the big firms.
How Top RIAs Use
Annotations Effectively
Perceived Expertise
The Problem
Clients can't evaluate your analytical skills by looking at a chart. They don't know if you're interpreting it correctly.
The Solution
Annotations demonstrate thought process. "This is what I see. This is why it matters. This is what we should do.
The Result
Client thinks: "My advisor really understands markets.
How Top RIAs Use Annotations
Effectively
Don't Over-
Annotate
- - 2-4 callouts per chart maximum
- - Focus on key insights only
- - Let the data speak where it's obvious
Add Your Own for
Portfolio Relevance
- - Fundstrat explains WHAT is happening in markets
- - You explain what it means for THIS CLIENT'S portfolio
Match Annotation
Complexity to Audience
- -Institutional clients: Keep Fundstrat's detailed technical annotations
- - Retail clients: Simplify or replace with plain-English versions
- - Prospects: Use punchy, high-level insights
Update Your Custom
Annotations Regularly
- - Fundstrat's annotations update automatically
- - Your custom annotations may need refreshing as your views evolve
- - Set reminders to review quarterly
Use Color Coding
Consistently
- - Always use your brand color for your annotations
- - Consistency aids comprehension
- - Always use same color for Fundstrat annotations across all charts
Test Readability Across
Devices
- - Preview annotations on mobile before sending
- - Ensure text size is legible on small screens
- - Avoid overly long annotations that require scrolling
Frequently Asked Questions
Human-written by Tom Lee, Mark Newton, Ken Xuan, and the Fundstrat analyst team. Not generic AI commentary.
Continuously. As market conditions change, the team reviews and updates annotations on key charts. Major updates typically weekly.
No, you can't edit theirs (they're locked for accuracy), but you can hide them and write your own, or add your own alongside theirs.
Only if you want them to. By default, annotations appear with no attribution. You can add "Source: Fundstrat" if desired, or brand them as your own.
Toggle it off and write your own. You're never forced to use annotations you don't agree with.
Yes, that's the entire purpose. Include them in chartbooks, PowerPoints, PDFs, or web links.
No. As a Fundstrat AI subscriber, you're licensed to use the annotations in client communications. Include standard disclaimers.
Yes (Professional and Enterprise plans). Submit requests via your account dashboard.
Fundstrat annotations only appear on Fundstrat data charts. You can add your own annotations to any chart, including uploads.