Data Center
Access our research through the lens of our charts and tables. View all of our charts (sorted by publishing date) on the left, and click on any chart to read the report in which it appeared.
Select the image you are interested in to load the corresponding report in the content section. This intuitive layout ensures that you can easily find and view reports based on their visual thumbnails.
-

Two Key Ways to Play the Rebound in the Consumer as Crude's Decline Continues
Thu, June 18, 2026 | 7:43PM ET -
Two Key Ways to Play the Rebound in the Consumer as Crude's Decline Continues
Thu, June 18, 2026 | 7:43PM ET -
Two Key Ways to Play the Rebound in the Consumer as Crude's Decline Continues
Thu, June 18, 2026 | 7:43PM ET -
Two Key Ways to Play the Rebound in the Consumer as Crude's Decline Continues
Thu, June 18, 2026 | 7:43PM ET -
Two Key Ways to Play the Rebound in the Consumer as Crude's Decline Continues
Thu, June 18, 2026 | 7:43PM ET -
Two Key Ways to Play the Rebound in the Consumer as Crude's Decline Continues
Thu, June 18, 2026 | 7:43PM ET -
Two Key Ways to Play the Rebound in the Consumer as Crude's Decline Continues
Thu, June 18, 2026 | 7:43PM ET -
China Helped Hold Down Oil Prices. Is It About to Go Shopping?
Thu, June 18, 2026 | 8:49AM ET

Mark L. Newton, CMT AC
Two Key Ways to Play the Rebound in the Consumer as Crude's Decline Continues
Key Takeaways
- Consumer stocks have begun to rebound, and two ways I like playing this move are Airlines ($JETS), which are nearing a multi-year breakout, and Homebuilders ($XHB).
- Semiconductors have stormed right back to new all-time highs, and despite frighteningly high overbought conditions, the near-term trend remains constructive.
- Thursday's bounce, with both Crude and interest rates falling, makes it right to lean bullish and use any weakness to add exposure, with the June lows the line in the sand.
Near-term US Equity trends remain bullish, and this week’s recovery has a lot of positives that look technically encouraging for the weeks ahead. Momentum has snapped back, given “Tech’s” rebound, and there continues to be a broadening out in sector participation, which looks healthy for the US stock market. Since early June, the price action has been a bit of a tug of war between the new, more hawkish Warsh-led Fed and the ceasefire trade, but I view the latter as the bigger positive for the market: a reopening Strait that pulls Crude and interest rates, and eventually the US Dollar, lower. Bottom line, this looks like a meaningful tailwind for the Consumer. While the US Dollar and rates have not begun to move down as quickly as WTI Crude in recent weeks, this should be forthcoming as risk assets continue to trade better on stability in the Persian Gulf. Bottom line, it’s right to lean bullish and use any weakness to add exposure, with the June lows as the line in the sand.
Sector performance: Technology still leads, but the broadening underneath is the bigger story
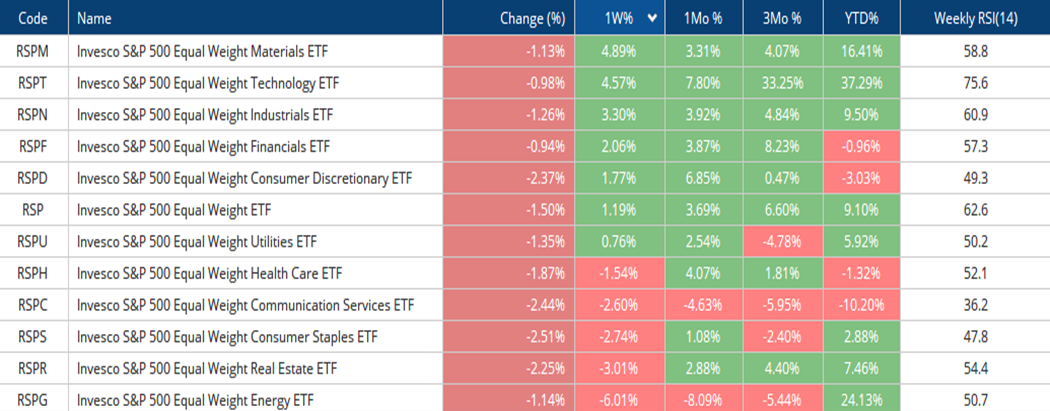
As shown below in this table of Equal-weighted Sector ETFs, the performance (ranked by one-week returns) underscores both Technology’s dominance and the broadening underneath it. Over the trailing month, equal-weight Technology (RSPT2.32% ) leads at +7.80%, with equal-weight Consumer Discretionary (RSPD1.41% ) close behind at +6.85%, a notable shift given Discretionary is still down -3.03% on the year.
Energy (RSPG-1.54% ) remains the clear laggard, off -8.09% over the past month and the one sector I have at Underweight. Year-to-date, Technology’s +37.29% dwarfs every other group, while Communication Services (RSPC0.17% ) is the weakest at -10.20%. Weekly RSI sits highest at 75.6 on Technology and lowest on Communication Services at 36.2.
The key takeaway here is that the comeback in Financials, Materials, Industrials, and Consumer Discretionary are big positives which help to reinforce a bullish stance, specifically given Technology’s ongoing outperformance. While “Tech” has gotten overbought, the rally in these other sectors is helpful and should begin to help the market push up a bit more aggressively into summer.
Invesco S&P 500 Equal-Weight Sector Performance (1W / 1M / 3M / YTD, Weekly RSI)
QQQ2.39% bounces off the 722 support, recovering most of the post-FOMC dip
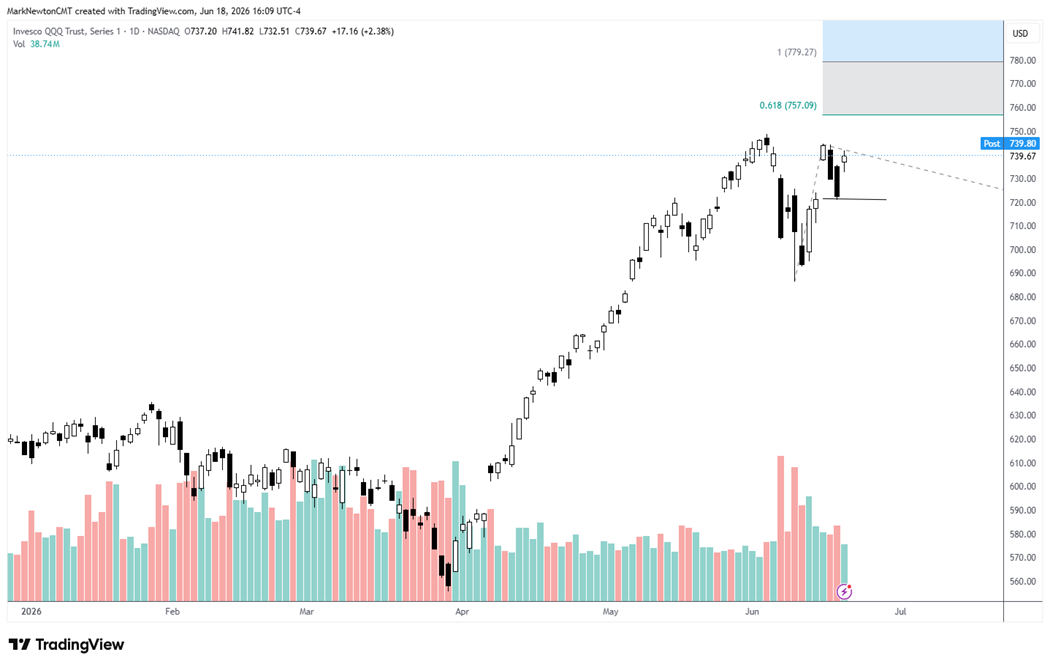
QQQ2.39% rallied Thursday to close near 739.67, up +2.38%, recovering most of the post-FOMC pullback from Monday’s high near 750 down to the 722 area. The bounce held that 722 support and keeps the rising trend off the April lows intact, with the recovery in mega-cap Technology and the Semis doing the heavy lifting even without overwhelming breadth.
This area was precisely at the former open gap from last Friday’s close into Monday, which gives this some special significance as an area of support where Wednesday’s decline managed to hold.
Overhead, the Fibonacci levels at 757.09 and 779.27 mark the next upside references. It would take a daily close back beneath 722 to raise any near-term concern, and I am skeptical that happens right away.
Invesco QQQ Trust (QQQ2.39% , daily) – Bounce following the test of the “open-gap” recovers most of the post-FOMC pullback
Semiconductors storm back to new all-time highs, a clear positive despite the longer-term overbought concern
On top of the positives of the multiple sector breakouts in the last week in Banks, Industrials, Healthcare, Utilities, and REITs, we’ve seen Semiconductors storm right back to new highs. This group, along with the broader market, declined for just six trading sessions before pushing back to new high territory this week.
I continue to have intermediate-term concerns about the longevity of this group’s rally potential between now and the mid-term Elections, given its monthly RSI reading creeping toward 90, which would mark one of the more overbought readings in history, above levels reached in late 2021 and 2000 at bull market peaks, with only 1995 being slightly above.
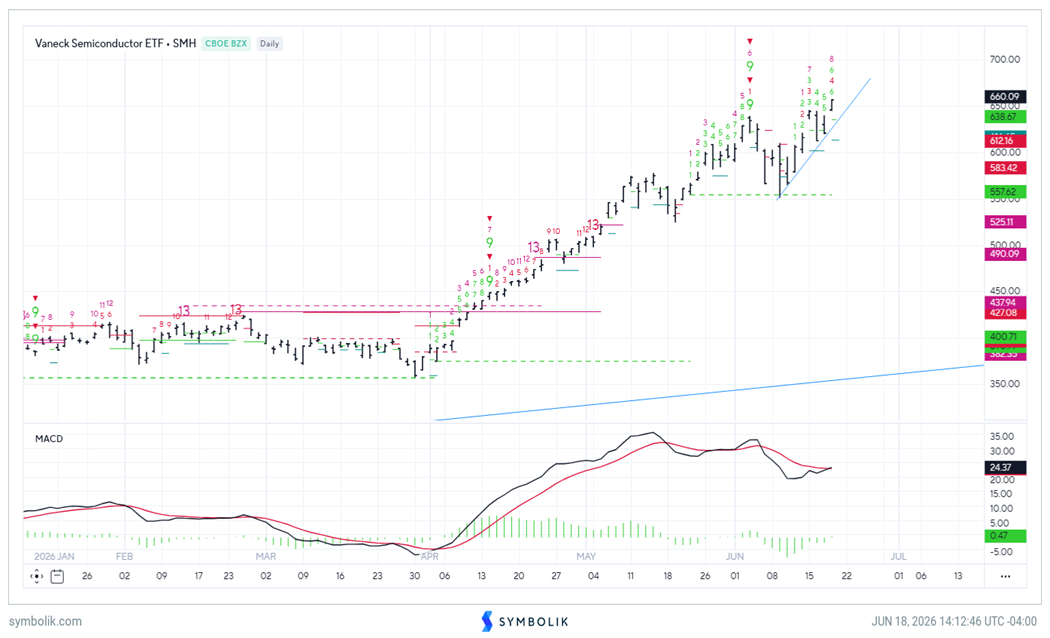
However, the daily charts have not broken down, and the consolidation from early June has now given way to a definite bullish pattern in today’s push back to new highs. My technical thinking is that it’s right to stick with this move until it starts to weaken, which would happen on a move back under 595. While daily momentum based on RSI does show some negative divergence, that’s not apparent on weekly or monthly charts given the SOX index’s 2026 strength. (The chart shown below is the VanEck Semiconductor ETF (SMH5.79% ), which I’m using as a proxy for the SOX index.)
Until that happens, or at a minimum a reversal on this move to new highs that moves back below the pivot area of the breakout at 642.77 (which both SMH5.79% and SOXX6.39% would suggest is still premature given no DeMark exhaustion on the daily charts), one needs to stick with the trend. Most Fibonacci-based projections don’t show much confluence until around 710–714, so I think this area should be considered important technically as resistance. Given how overbought this has become, one should pay close attention to any failure in this group in the week(s) ahead, but for now, today’s move is certainly a technical positive in the short run.
VanEck Semiconductor ETF (SMH5.79% , daily) – Storming back to new all-time highs after a six-session consolidation in early June
Consumer Discretionary (RSPD1.41% ) rebounds to test its 2026 downtrend as the Consumer comes back to life
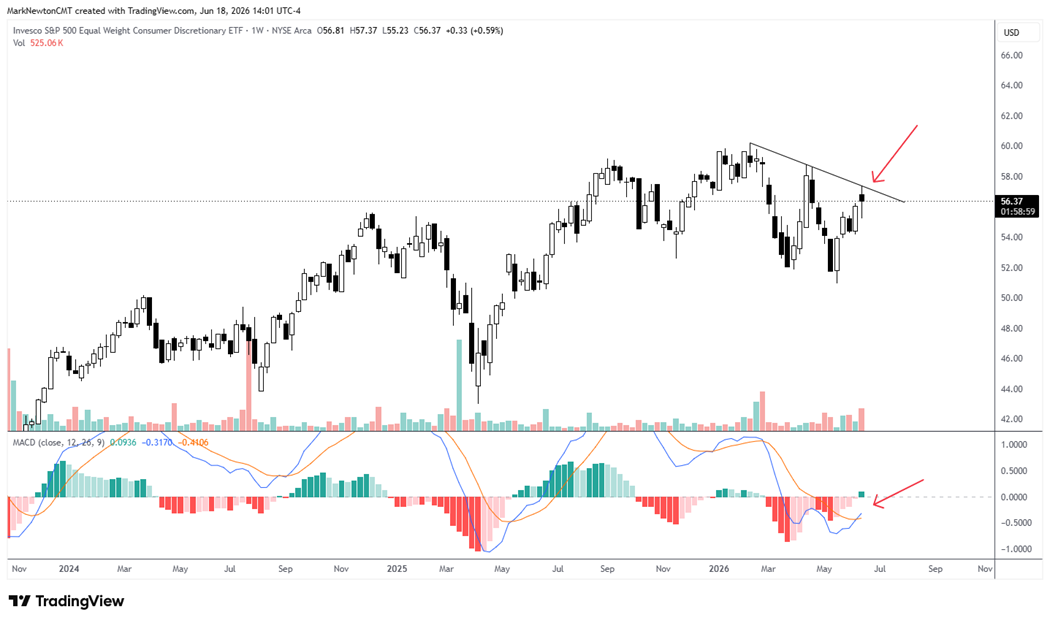
Equal-weight Consumer Discretionary (RSPD1.41% ) has rallied back to 56.37 and is pushing up to test the descending trendline from the early-2026 highs near 60, with weekly MACD having crossed back above its signal line, so the trend is turning more positive and a coming breakout looks likely.
This fits the broadening theme, as Discretionary is up +6.85% over the past month, second only to Technology, despite still being down on the year. The trendline has not broken yet, so a weekly close above it and back over the prior 58 area would confirm the breakout.
The two cleanest ways to play this rebound in the Consumer are Airlines and Homebuilders, both covered below.
Invesco S&P 500 Equal-Weight Consumer Discretionary ETF (RSPD1.41% , weekly) – Rebounding to test the 2026 downtrend
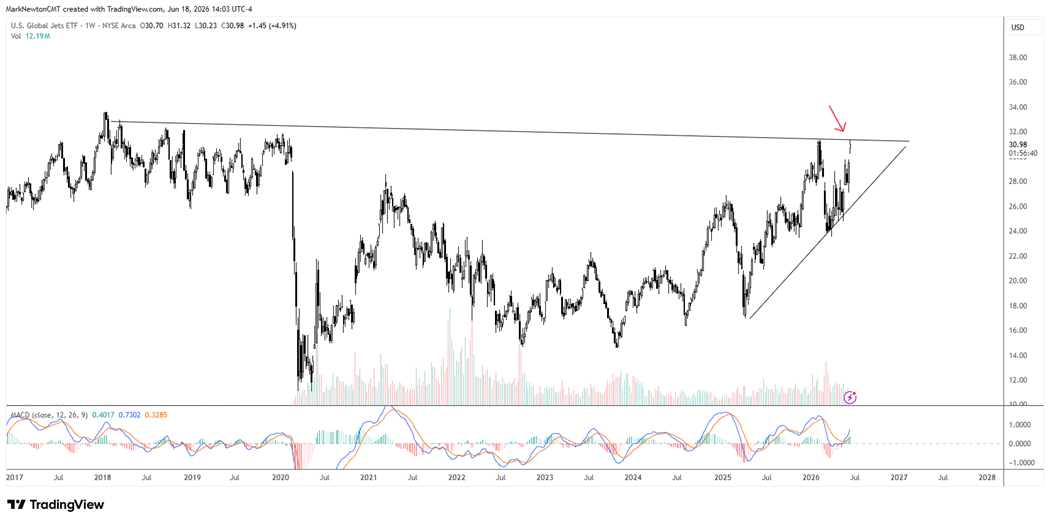
Airlines (JETS2.48% ) are nearing a multi-year breakout, the first way to play the Consumer, with falling Crude the tailwind
U.S. Global Jets ETF (JETS2.48% ) surged +4.91% this week to 30.98 and is nearing a multi-year breakout, pushing into the long-term descending resistance from the 2018 highs near 32 at the apex of a multi-year base. This is one of the purest ways to play a decline in the price of WTI Crude oil and is a notable tailwind to Airline stocks, given jet fuel’s outsized share of airline operating costs.
A weekly close above the 32 area would mark a major multi-year breakout and open meaningful upside to the high $30s at a minimum. I am bullish on the group, and stocks like DAL2.35% are quite attractive and are a source of leadership for the Airlines.
Given that WTI Crude might pull back down to the mid-$60s into late next week before a minor bounce, I suspect that a breakout in the Airlines could be imminent.
Specifically, the fact that price has pushed up aggressively to test the prior peak from early 2026 is a big technical positive. This sub-sector needs to be watched carefully in the weeks ahead for evidence of this move.
Bottom line, I like being long JETS2.48% and also DAL2.35% for a coming intermediate-term breakout in Airlines.
U.S. Global Jets ETF (JETS2.48% , weekly) – Nearing a multi-year breakout at the apex of the symmetrical triangle
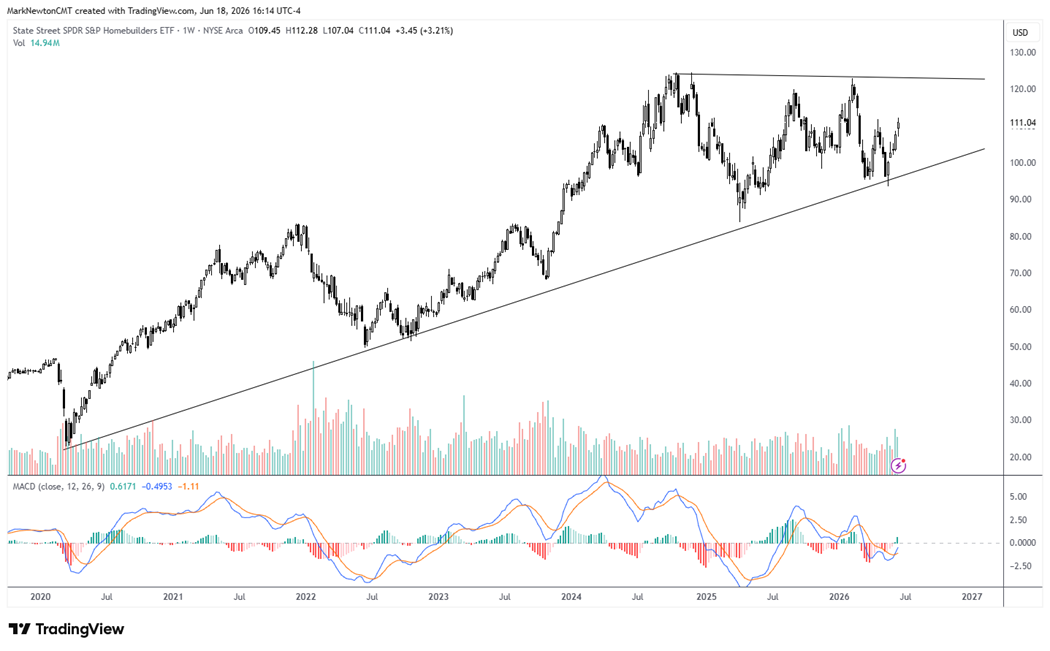
Homebuilders (XHB3.46% ) have achieved a minor breakout to the initial 112 target, the second way to play the Consumer
SPDR S&P Homebuilders ETF (XHB3.46% ) has rallied +3.21% this week to 111.04, achieving the minor breakout discussed on 6/9 in my note, and reaching the initial target near 112.
This weekly chart I chose to show below is quite different from the daily chart posted a few weeks ago and helps to put this recent price action into perspective.
This entire trading history since 2024 represents a bullish ascending triangle pattern in my view.
XHB3.46% has rebounded off the rising trendline support from the 2020 lows, and I expect it now works up to the top of its multi-year range, near the descending resistance trendline around 123.
The drop in the 10-year yield, which should start to accelerate lower (not higher) in the weeks ahead, should prove to be a key driver here given housing’s rate sensitivity, and with weekly MACD curling back up, I am bullish on the group alongside the Airlines.
SPDR S&P Homebuilders ETF (XHB3.46% , weekly) – Minor breakout to the initial 112 target, with the range top near 123 next
Bottom Line
- I expect QQQ2.39% and ^SPX0.89% to push back to new all-time highs by the end of the month, joining the Dow Jones Industrial Average and the equal-weight S&P (RSP0.42% ), which are already back at new highs.
- The broadening and the increasing amount of participation across sectors is a very big positive technically, and is the kind of participation a durable advance tends to be built on.
- This is happening with sentiment still largely muted and far from optimistic, and that contrarian backdrop is another positive that should help markets continue to do okay.
To unsubscribe from this email, please click here. You can also manage your email preferences and opt out of other types of emails by clicking here.