Data Center
Access our research through the lens of our charts and tables. View all of our charts (sorted by publishing date) on the left, and click on any chart to read the report in which it appeared.
Select the image you are interested in to load the corresponding report in the content section. This intuitive layout ensures that you can easily find and view reports based on their visual thumbnails.
-
July 2026 Technical Outlook
Fri, July 31, 2026 | 3:49PM ET -
July 2026 Technical Outlook
Fri, July 31, 2026 | 3:49PM ET -
July 2026 Technical Outlook
Fri, July 31, 2026 | 3:49PM ET -
Is a Continental Drift Coming for AI?
Fri, July 31, 2026 | 8:58AM ET -
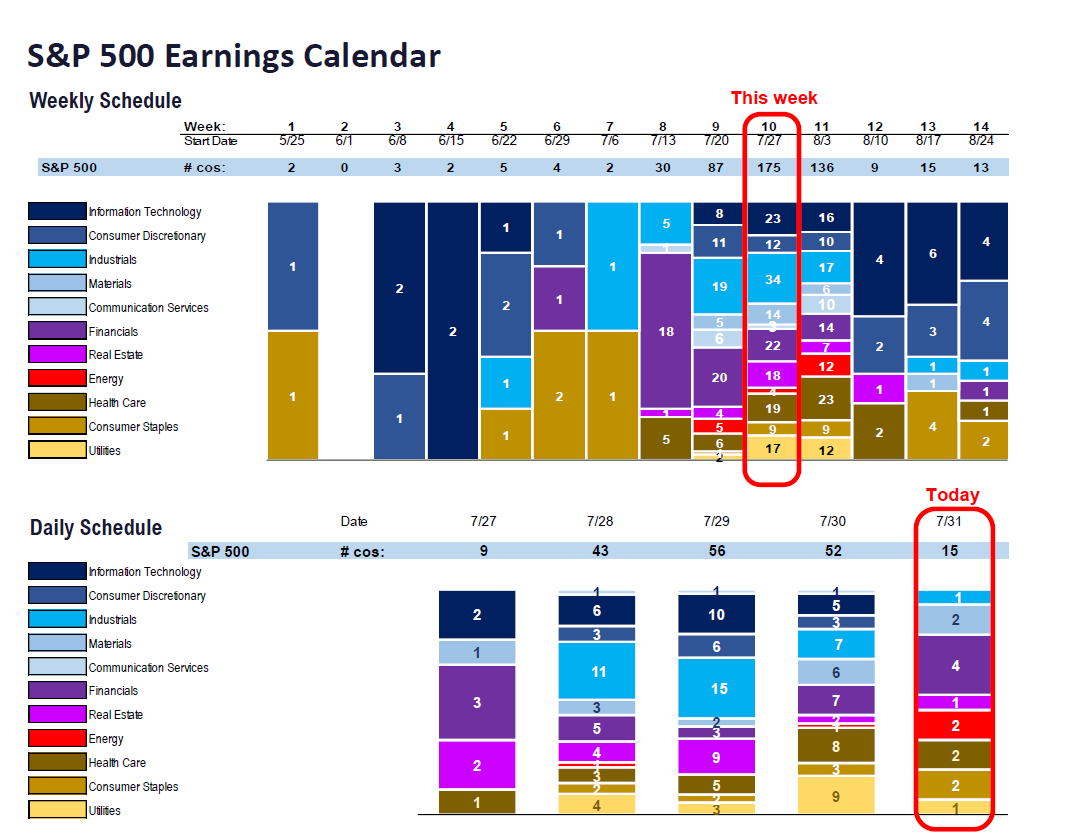
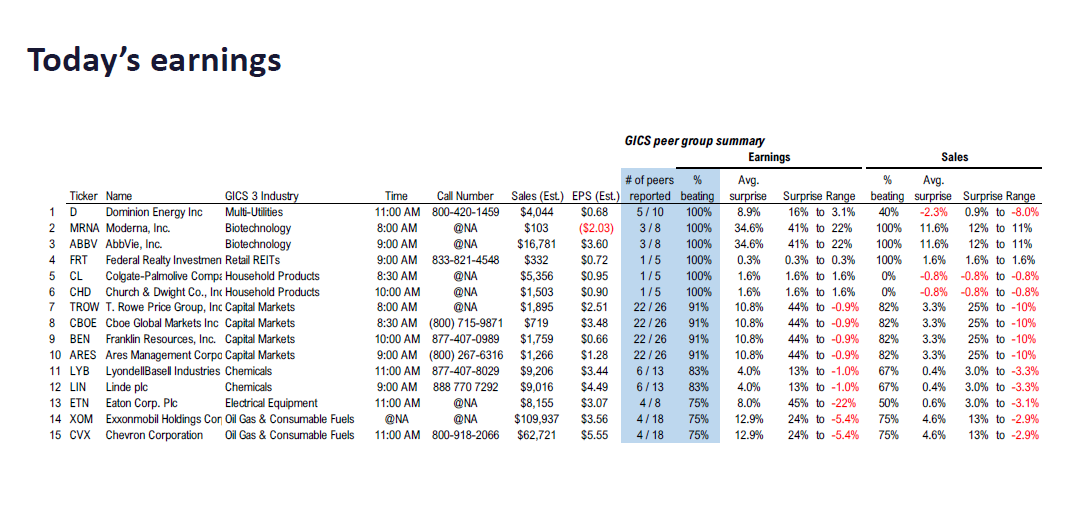
Fundstrat 2Q26 Daily Earnings (EPS) Update – 07/31/2026
Fri, July 31, 2026 | 6:30AM ET -
Fundstrat 2Q26 Daily Earnings (EPS) Update – 07/31/2026
Fri, July 31, 2026 | 6:30AM ET -
Fundstrat 2Q26 Daily Earnings (EPS) Update – 07/31/2026
Fri, July 31, 2026 | 6:30AM ET -
Fundstrat 2Q26 Daily Earnings (EPS) Update – 07/31/2026
Fri, July 31, 2026 | 6:30AM ET -
Fundstrat 2Q26 Daily Earnings (EPS) Update – 07/31/2026
Fri, July 31, 2026 | 6:30AM ET -
Fundstrat 2Q26 Daily Earnings (EPS) Update – 07/31/2026
Fri, July 31, 2026 | 6:30AM ET

July 2026 Technical Outlook
For full report, please click HERE.
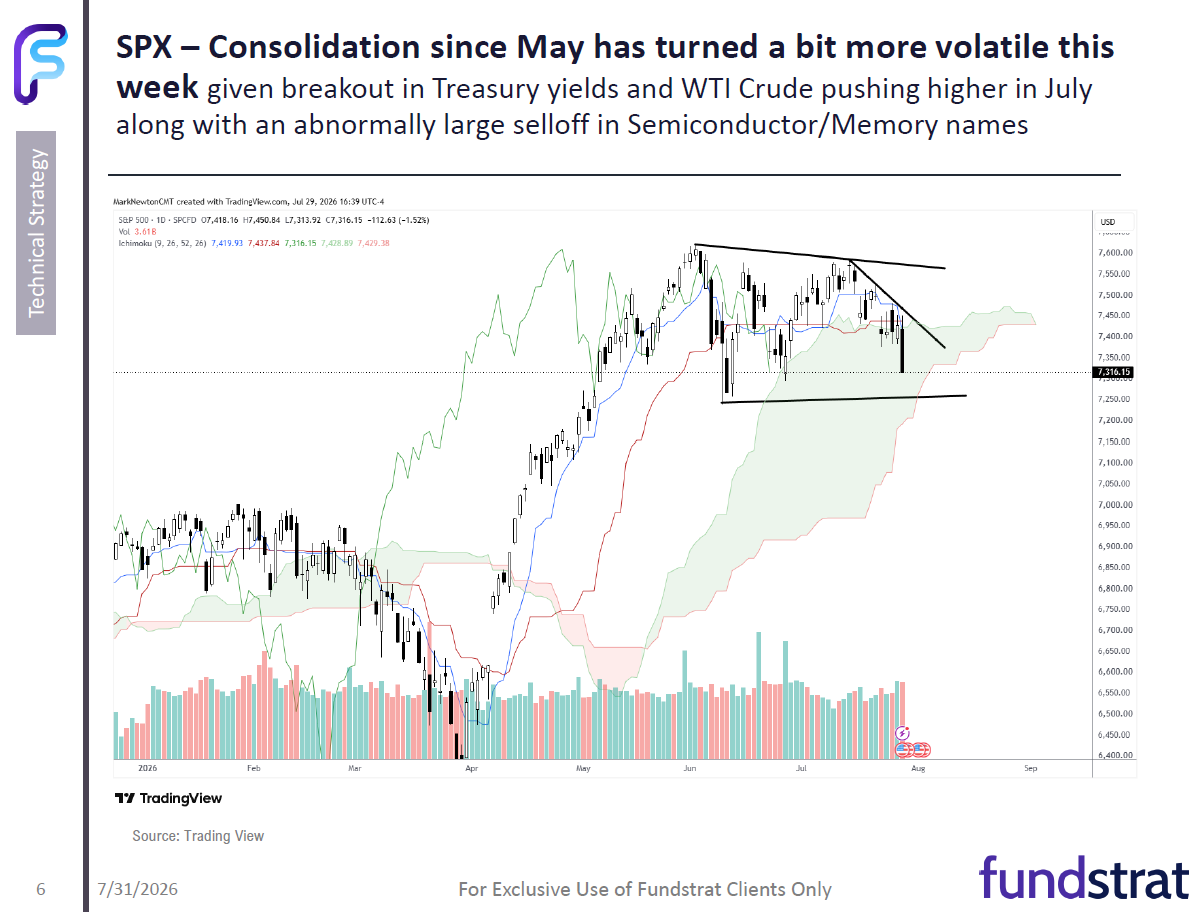
Technically, US Equities are in better shape than might be expected despite Tech woes
- Broad-based recovery in Healthcare, Financials, and Industrials over the last month has proven quite helpful towards lifting DJIA and Equal-weighted SPX, while Technology has fallen.
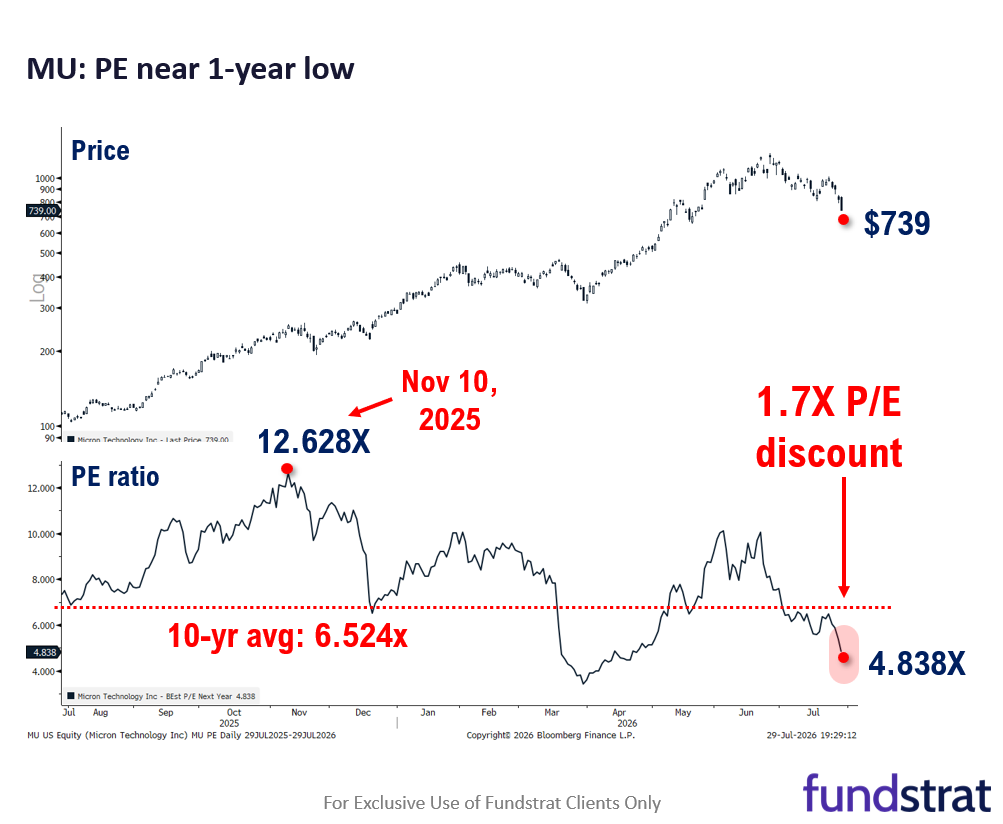
- Technology’s consolidation has happened gradually and not all at once. Software and Magnificent 7” stocks have both begun to stabilize, while the decline in Semiconductor and Memory stocks looks close to bottoming.
- “Magnificent 7” has begun to turn higher and outperform the Equal-weighted SPX after months of underperformance.
- WTI Crude’s July bounce looks to be nearing resistance and likely turns down in August. This should be beneficial for risk assets. Selloff back down to the low $70’s possible.
- Sentiment remains neutral to negative, and has not gotten too speculative; AAII still shows higher levels of Bearish sentiment than Bullish, not normally a starting point for any meaningful selloff.
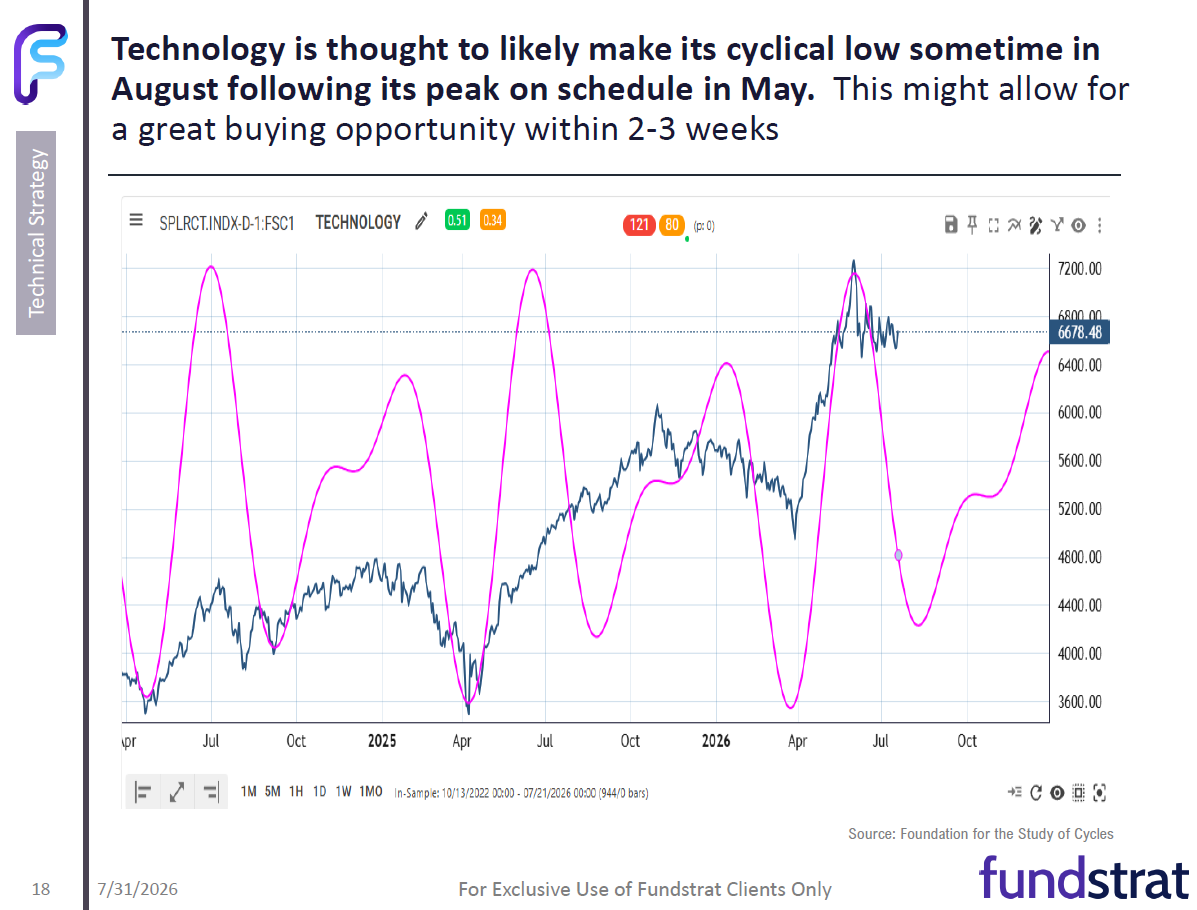
- Cycle composites for Technology, which were downward sloping from May, now show a bottoming in Technology in August; Tech is thought to likely bottom before the end of Q3.
What remains a concern, technically speaking
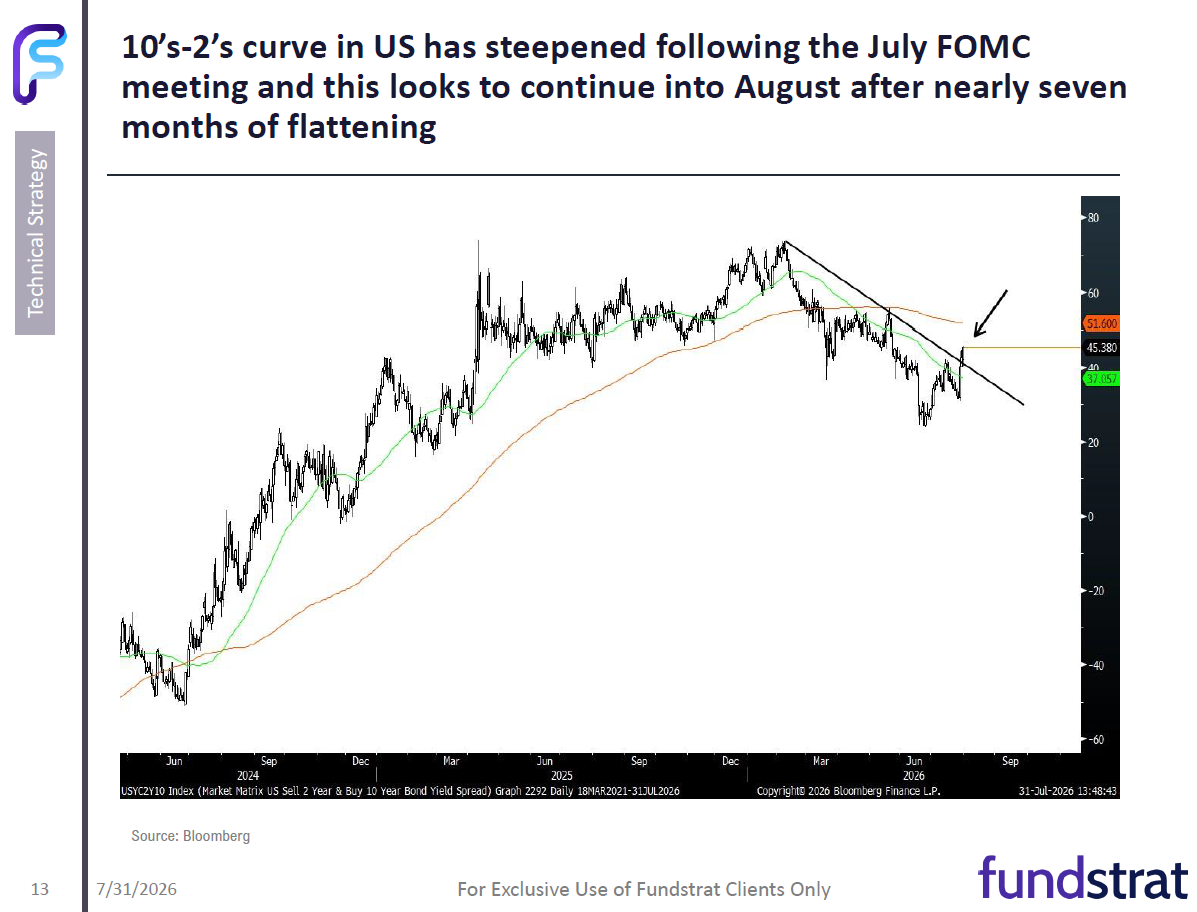
- Long-term interest rates have started to break out of well-defined triangle consolidation patterns in the last couple weeks to join the strength being seen in sovereign yields in UK, Germany, and Japan.
- While cycles suggest a bottom in Technology should arrive by the middle part of August, this doesn’t look to be at hand yet. DeMark indicators on ratio charts of Tech vs. SPX suggest another 2-3 weeks potentially.
- Sectors like Industrials have been weakening of late and this looks important as Industrials were one of the few sectors to have hit all-time highs last month. While no broad-based decline looks imminent in non-Tech-related sectors yet, this will be something to keep an eye on.
- Warsh’s lack of communication looks to be driving more volatility in the bond market and this might not change anytime soon.
- Cross-asset volatility looks to be returning, given the rapid movement in the Japanese Yen, Treasuries, Crude oil and US Dollar in recent weeks.
- Consumer stocks have been under relentless pressure in recent months and largely failed to outperform during the early part of the Summer.
- Market breadth has waned a bit given the sideways pattern in SPX and QQQ since May, and now momentum is negatively sloped (Based on MACD) on both a daily and weekly basis.
To unsubscribe from this email, please click here. You can also manage your email preferences and opt out of other types of emails by clicking here.