Data Center
Access our research through the lens of our charts and tables. View all of our charts (sorted by publishing date) on the left, and click on any chart to read the report in which it appeared.
Select the image you are interested in to load the corresponding report in the content section. This intuitive layout ensures that you can easily find and view reports based on their visual thumbnails.
-
April a new month. Leadership remains Energy, Crypto, Tech and Rate sensitives
Tue, March 31, 2026 | 9:12PM ET -
April a new month. Leadership remains Energy, Crypto, Tech and Rate sensitives
Tue, March 31, 2026 | 9:12PM ET -
April a new month. Leadership remains Energy, Crypto, Tech and Rate sensitives
Tue, March 31, 2026 | 9:12PM ET -
April a new month. Leadership remains Energy, Crypto, Tech and Rate sensitives
Tue, March 31, 2026 | 9:12PM ET -
April a new month. Leadership remains Energy, Crypto, Tech and Rate sensitives
Tue, March 31, 2026 | 9:12PM ET -
April a new month. Leadership remains Energy, Crypto, Tech and Rate sensitives
Tue, March 31, 2026 | 9:12PM ET -

April a new month. Leadership remains Energy, Crypto, Tech and Rate sensitives
Tue, March 31, 2026 | 9:12PM ET -

April a new month. Leadership remains Energy, Crypto, Tech and Rate sensitives
Tue, March 31, 2026 | 9:12PM ET -
April a new month. Leadership remains Energy, Crypto, Tech and Rate sensitives
Tue, March 31, 2026 | 9:12PM ET -
April a new month. Leadership remains Energy, Crypto, Tech and Rate sensitives
Tue, March 31, 2026 | 9:12PM ET -
April a new month. Leadership remains Energy, Crypto, Tech and Rate sensitives
Tue, March 31, 2026 | 9:12PM ET -
April a new month. Leadership remains Energy, Crypto, Tech and Rate sensitives
Tue, March 31, 2026 | 9:12PM ET -
April a new month. Leadership remains Energy, Crypto, Tech and Rate sensitives
Tue, March 31, 2026 | 9:12PM ET -
April a new month. Leadership remains Energy, Crypto, Tech and Rate sensitives
Tue, March 31, 2026 | 9:12PM ET -
April a new month. Leadership remains Energy, Crypto, Tech and Rate sensitives
Tue, March 31, 2026 | 9:12PM ET -
April a new month. Leadership remains Energy, Crypto, Tech and Rate sensitives
Tue, March 31, 2026 | 9:12PM ET -
April a new month. Leadership remains Energy, Crypto, Tech and Rate sensitives
Tue, March 31, 2026 | 9:12PM ET -
April a new month. Leadership remains Energy, Crypto, Tech and Rate sensitives
Tue, March 31, 2026 | 9:12PM ET -

April a new month. Leadership remains Energy, Crypto, Tech and Rate sensitives
Tue, March 31, 2026 | 9:12PM ET -
April a new month. Leadership remains Energy, Crypto, Tech and Rate sensitives
Tue, March 31, 2026 | 9:12PM ET -

Quantum Risk Moves Closer, ETH May Be Better Positioned
Tue, March 31, 2026 | 8:53PM ET -

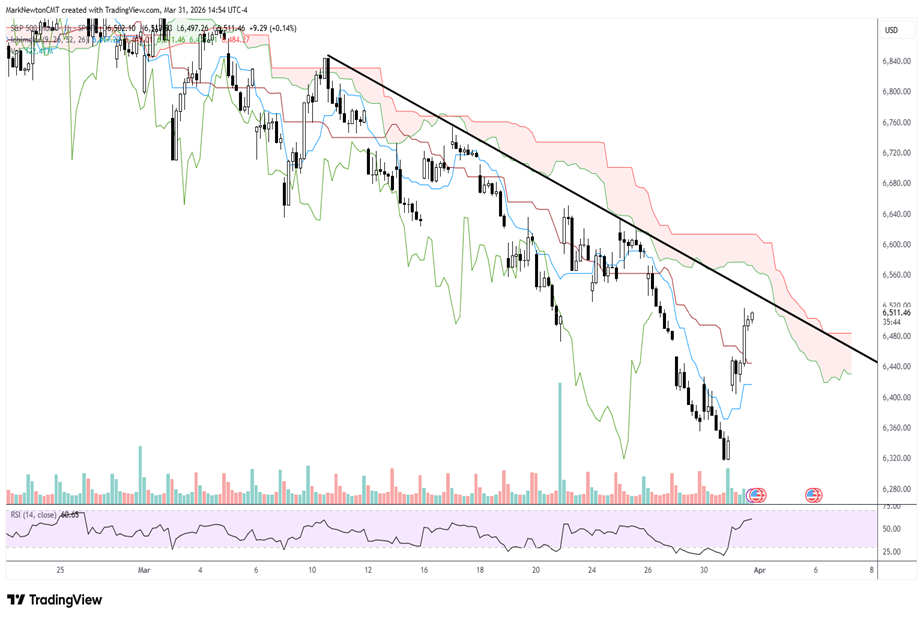
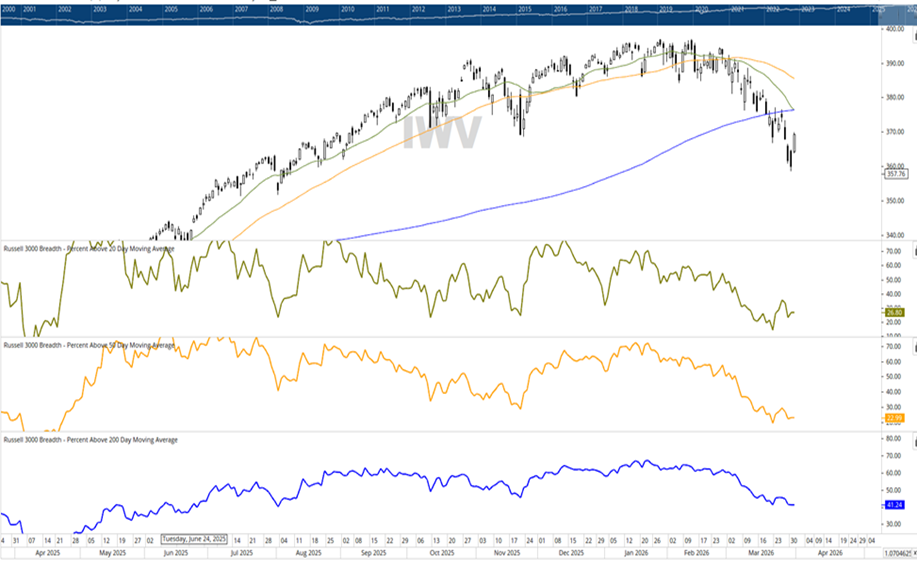
Massive rally not quite enough to change Equity trend - One More decline would be helpful
Tue, March 31, 2026 | 7:10PM ET -
Massive rally not quite enough to change Equity trend - One More decline would be helpful
Tue, March 31, 2026 | 7:10PM ET -
Massive rally not quite enough to change Equity trend - One More decline would be helpful
Tue, March 31, 2026 | 7:10PM ET -
Massive rally not quite enough to change Equity trend - One More decline would be helpful
Tue, March 31, 2026 | 7:10PM ET -
Massive rally not quite enough to change Equity trend - One More decline would be helpful
Tue, March 31, 2026 | 7:10PM ET -
March 2026 Technical Outlook
Tue, March 31, 2026 | 6:47PM ET -
March 2026 Technical Outlook
Tue, March 31, 2026 | 6:47PM ET -
March 2026 Technical Outlook
Tue, March 31, 2026 | 6:47PM ET

Thomas Lee, CFA AC
April a new month. Leadership remains Energy, Crypto, Tech and Rate sensitives
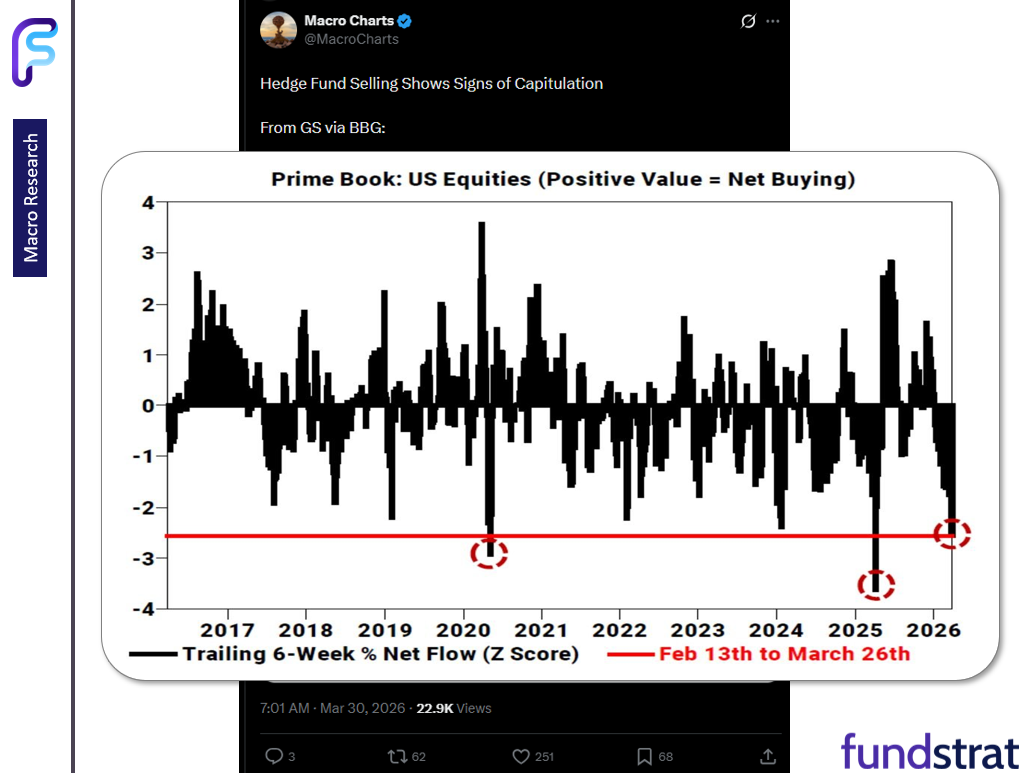
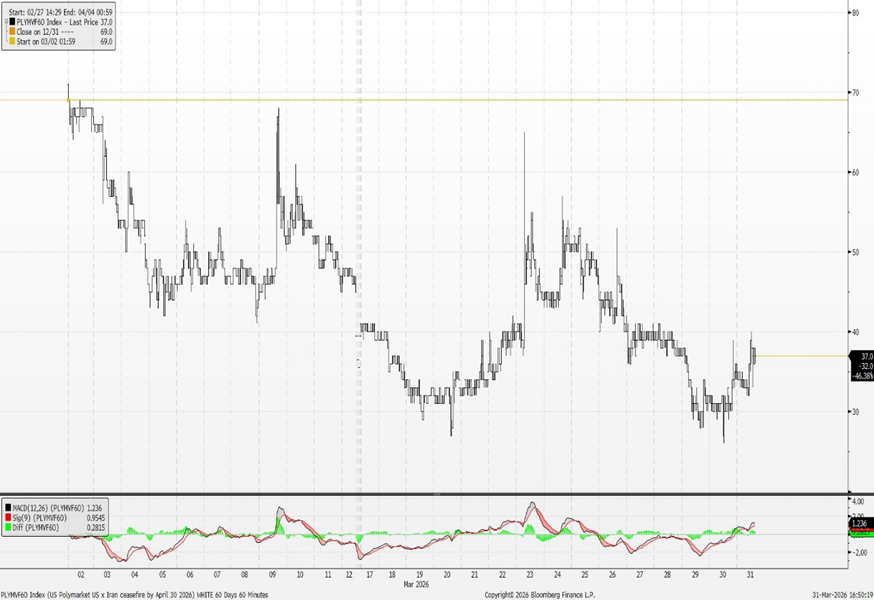
Equity markets gained on Tuesday March 31, as signs emerged of the end of this Iran War conflict, confirmed by statements from both sides — Trump and Iran. The positive reaction by markets is a reminder of the drastically cautious positioning of markets.
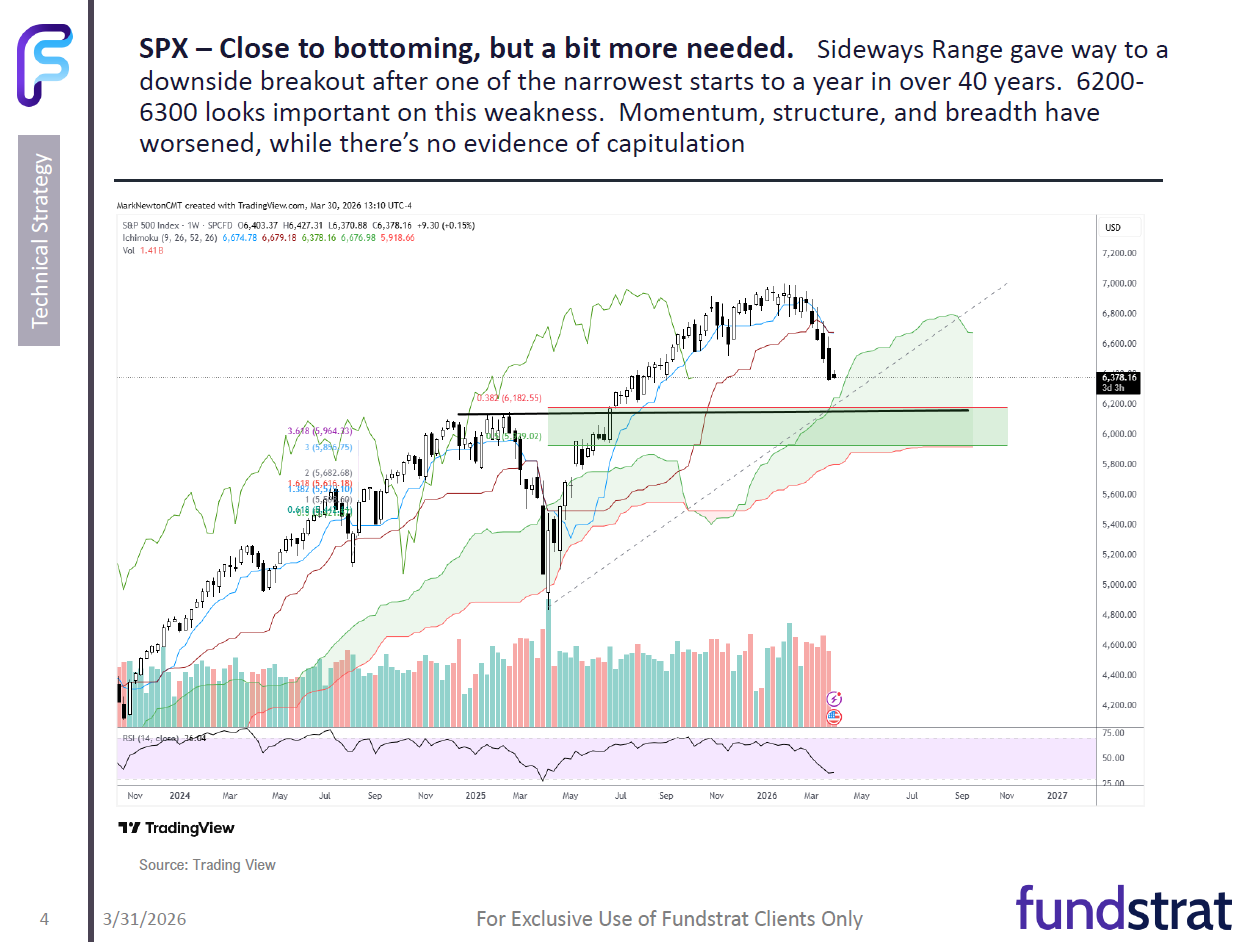
- March was a tough month for equities with S&P 500 down -4.6%. Given the surge in oil and the coming economic ripples, many investors naturally expect further downside for equities. Investors point to the 20% decline in S&P 500 in early 2025 as a recent precedent. As we look ahead to the month of April, our view is that we are closer to a bottom than those with dire forecasts.
- Mark Newton, Head of Technical Strategy, suggest he would like to see one last decline in S&P 500 towards 6,200-6,300 from 6,500-ish currently. Keep in mind that the S&P 500 was 6,300 or so on Friday and Monday. Hence, markets have been near the levels that Mark Newton sees as the low.
- Before one gets too bearish, there are a few things to be mindful of:
– first, historically, steep declines are followed by V-shaped recoveries
– at one point in March, the S&P 500 was down more than 8%
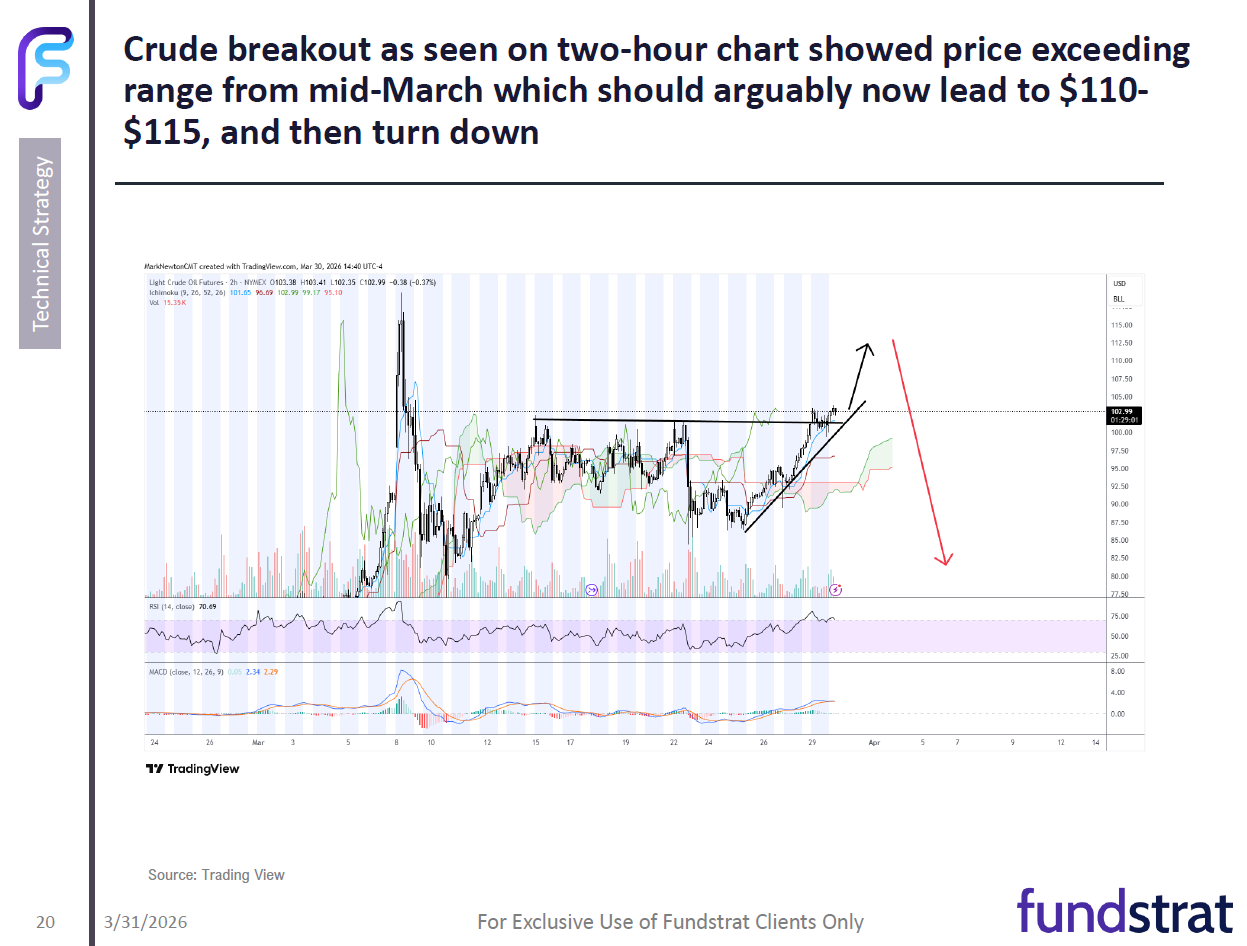
– second, the US economy is probably better equipped to handle $100 oil
– as many continue to view the US economy as chronically fragile
– third, President Trump may be seeking a quicker end to this war
– as indicated by the statements made at the start of this report - We have stated multiple times that we believe the US is ultimately a net beneficiary of higher oil, even as higher gasoline poses inflation and affordability issues for consumers and businesses. Please see our prior reports and videos to get a fuller discussion on that.
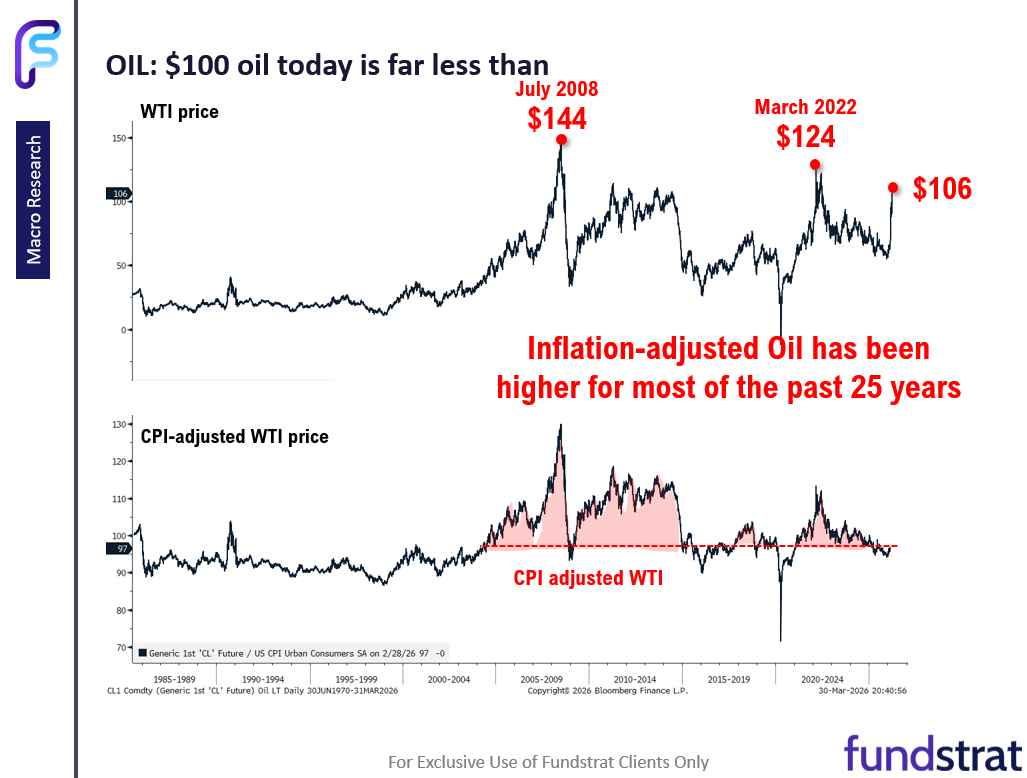
- But we also believe investors are overly concerned about $100 oil. Granted, this is quite a surge in prices and will create an inflation shock, short term. But consider the following:
– $100 WTI, inflation-adjusted, is lower than the average price of oil over the past 25 years
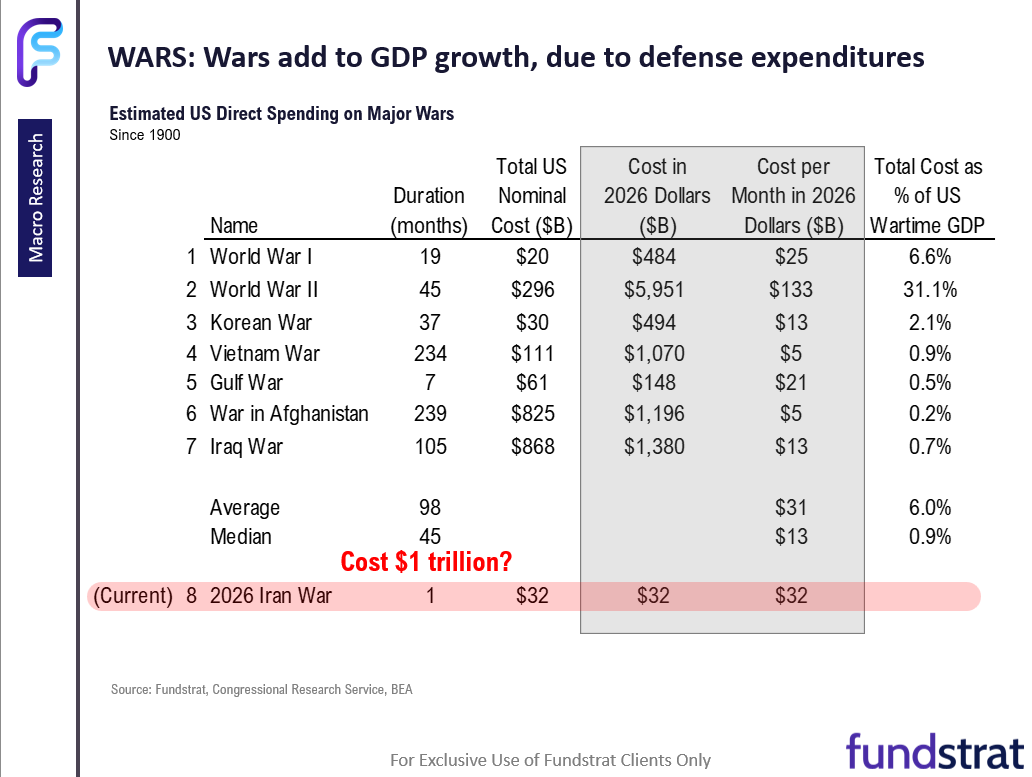
– US war spending is stimulating the economy and adding as much as $20-$30 billion to GDP per month, offsetting higher oil
– Oil would need to average $125 per barrel to offset this GDP impact
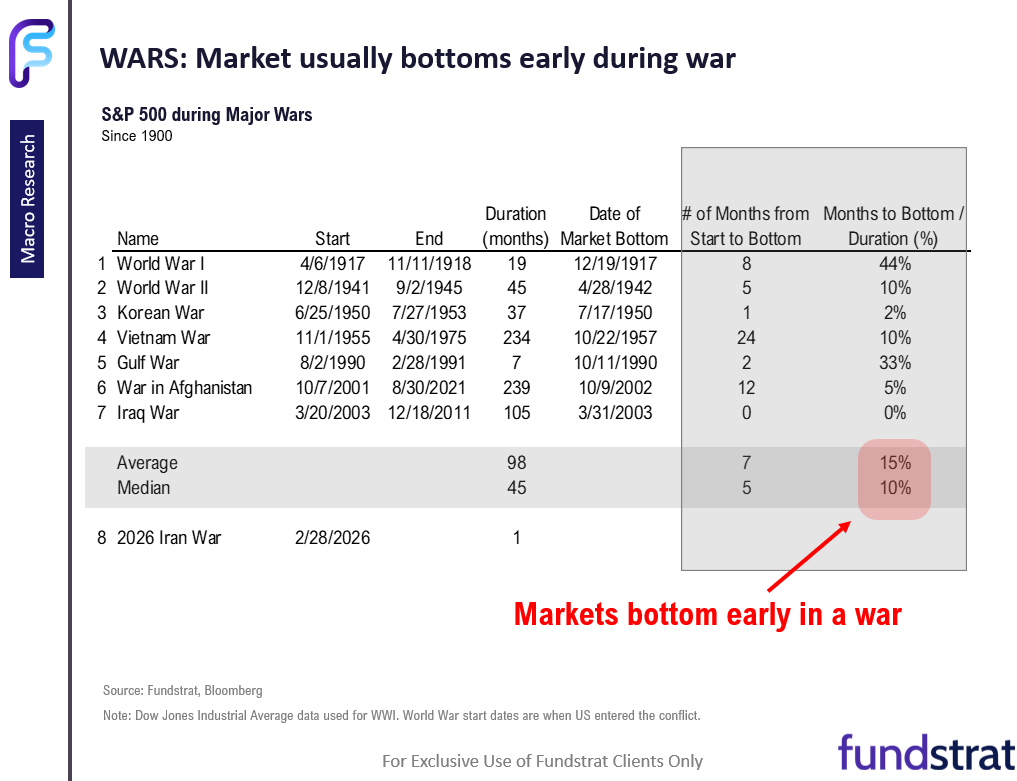
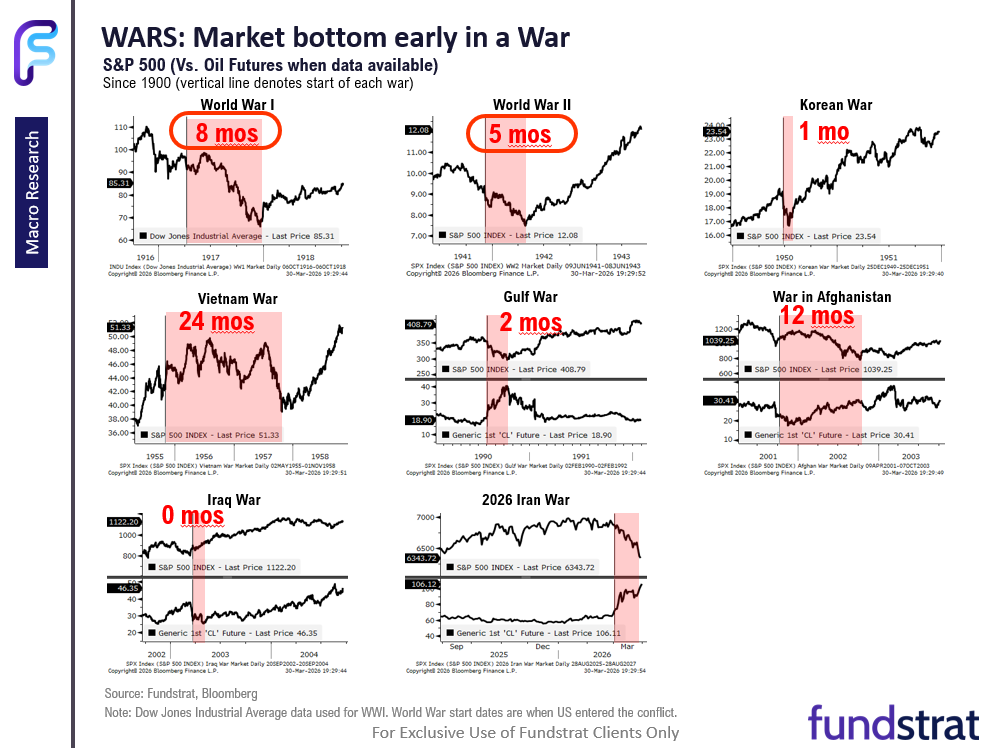
– Equity markets historically bottom within the first 10% of the duration of a war. - The highest nominal price for oil was seen in July 2008 at $144 per barrel. And today’s $106 is high. But also keep in mind that overall prices (inflation) are up 53% since 2008. Thus, to match the economic burden of 2008 prices of oil, oil today would need to be $220-$240. In fact, on inflation adjusted terms, the current price of oil is lower than most of the last 25 years.
- And the war’s duration is simply unknown. But as the tables and charts below highlight, equity markets have bottomed early in a conflict — looking at the 7 major conflicts since 1900. In fact, both WWI and WWII were mult-year wars, but the stock market bottomed in 8 and 5 months after the conflict started.
- Why is this the case? To me, it is evidence that markets price in adverse risks early and quickly. Thus, markets can find their bottom sooner.
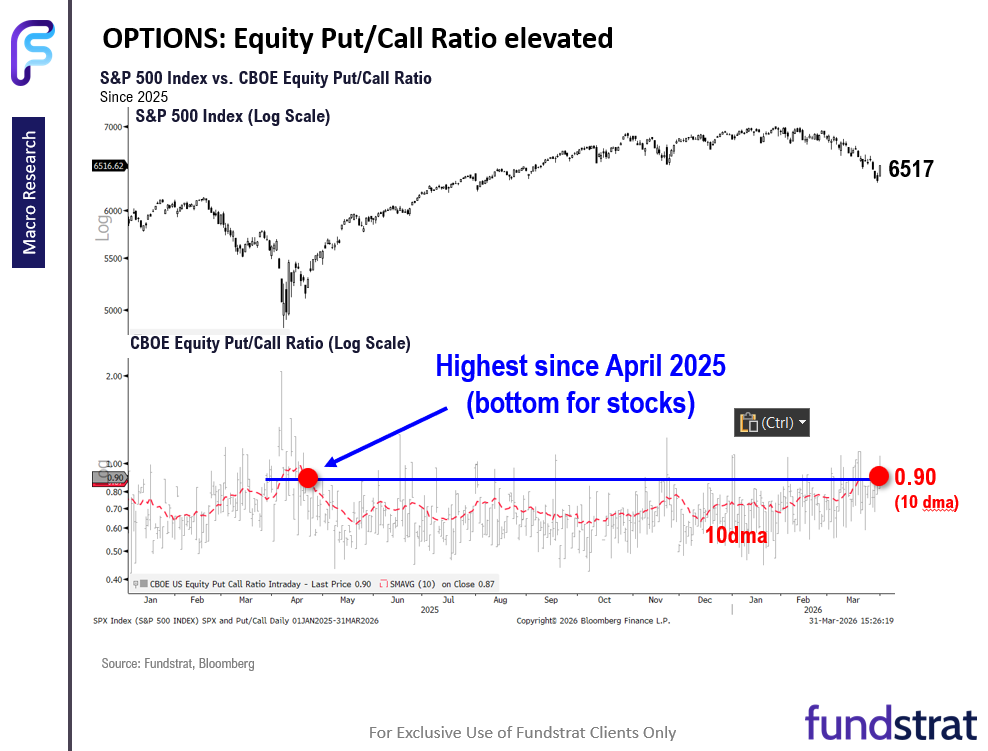
- The current equity-put call ratio (10 dma) is 0.9, which is the same average seen at the April 2025 lows. This gives us a sense that investors have already taken steps and prepared for further downside.
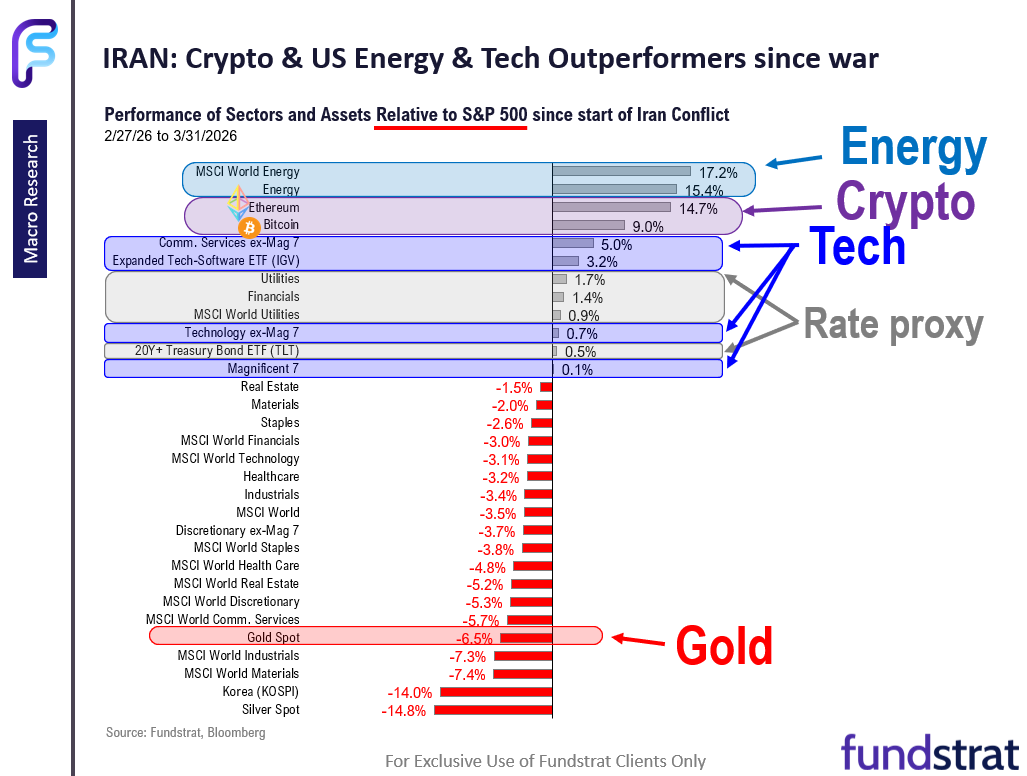
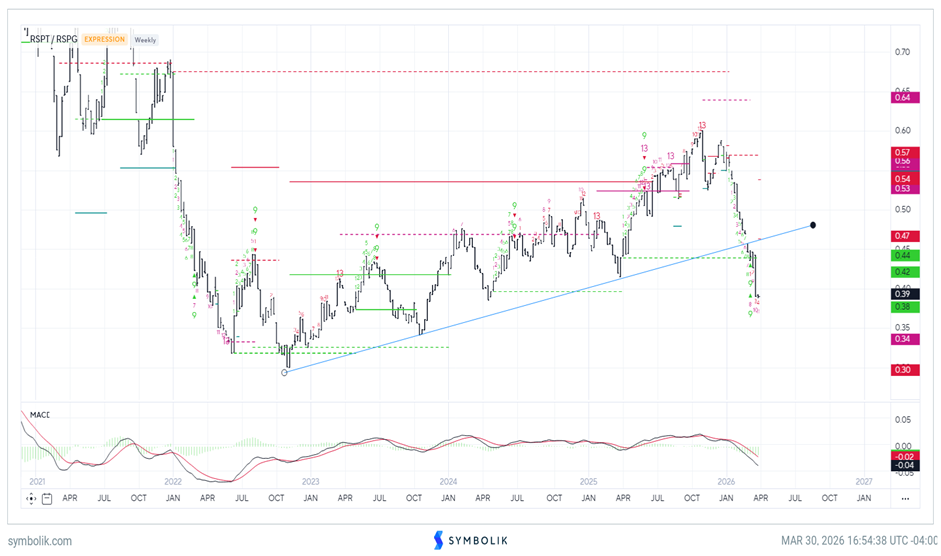
- 5 weeksn into this war, we are seeing sustained relative outperformance. The leaders since the War started are:
– Energy – no surprise
– Crpyto – Ethereum and Bitcoin ETH4.27% BTC2.77%
– Technology
– Rate sensitives incliuding Financials - These line up pretty closely to our sector recommendations currently.
- Next week we have important employment numbers, with the Feb JOLTS report on Tuesday, and the BLS Mar Jobs Report on Good Friday:
– 3/30 Mon 10:30 AM ET: Mar Dallas Fed Manuf. Activity Survey -0.2
– 3/30 Mon 10:30 AM ET: Powell in Moderated Discussion
– 3/31 Tue 9:00 AM ET: Jan S&P Cotality CS 20-City MoM SA 0.16% vs 0.35%e
– 3/31 Tue 10:00 AM ET: Mar Conference Board Consumer Confidence 92 vs 88e
– 3/31 Tue 10:00 AM ET: Feb JOLTS Job Openings 6882k vs 6890ke
– 4/1 Wed 8:30 AM ET: Feb Retail Sales 0.5%e
– 4/1 Wed 9:45 AM ET: Mar F S&P Global Manufacturing PMI 52.4e
– 4/1 Wed 10:00 AM ET: Mar ISM Manufacturing PMI 52.3e
– 4/2 Thu 8:30 AM ET: Feb Trade Balance -61be
– 4/3 Fri: Good Friday (Market Closed)
– 4/3 Fri 8:30 AM ET: Mar Non-farm Payrolls 65ke
– 4/3 Fri 9:45 AM ET: Mar F S&P Global Services PMI 51.1e
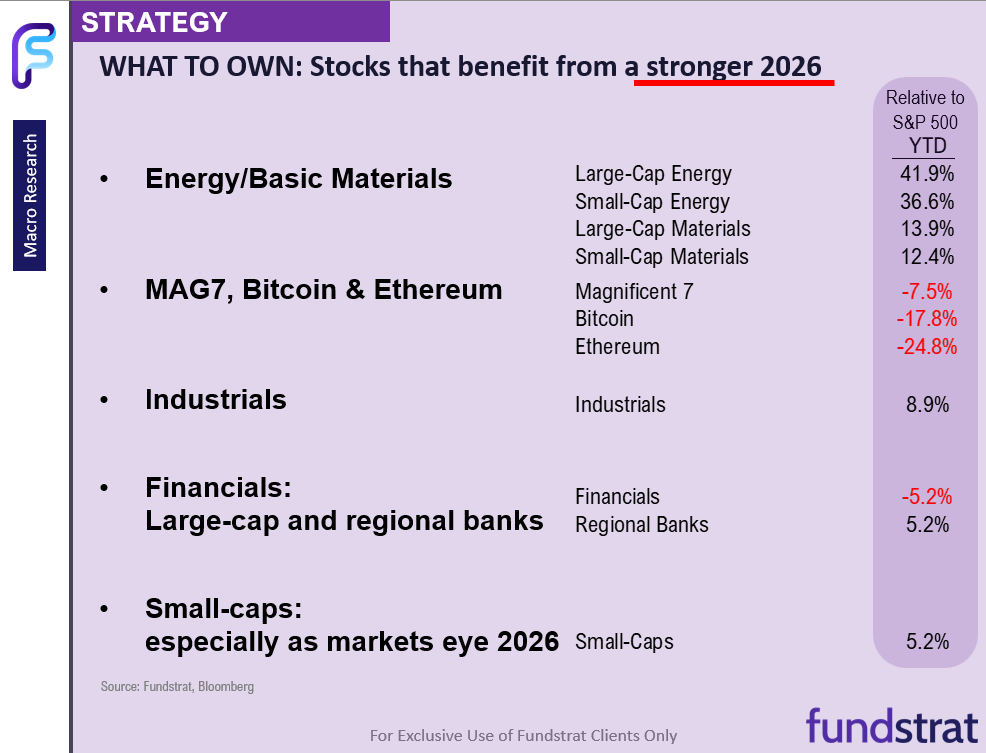
BOTTOM LINE: AI rotation to “bullet makers” is not end of MAG7
We believe we are 90% to 95% through this decline. Markets are climbing a wall of worry. We continue to view 2026 as an overall tougher year for markets, with a 3 phase market (rally, then large decline, then YE strong). And our positioning remains:
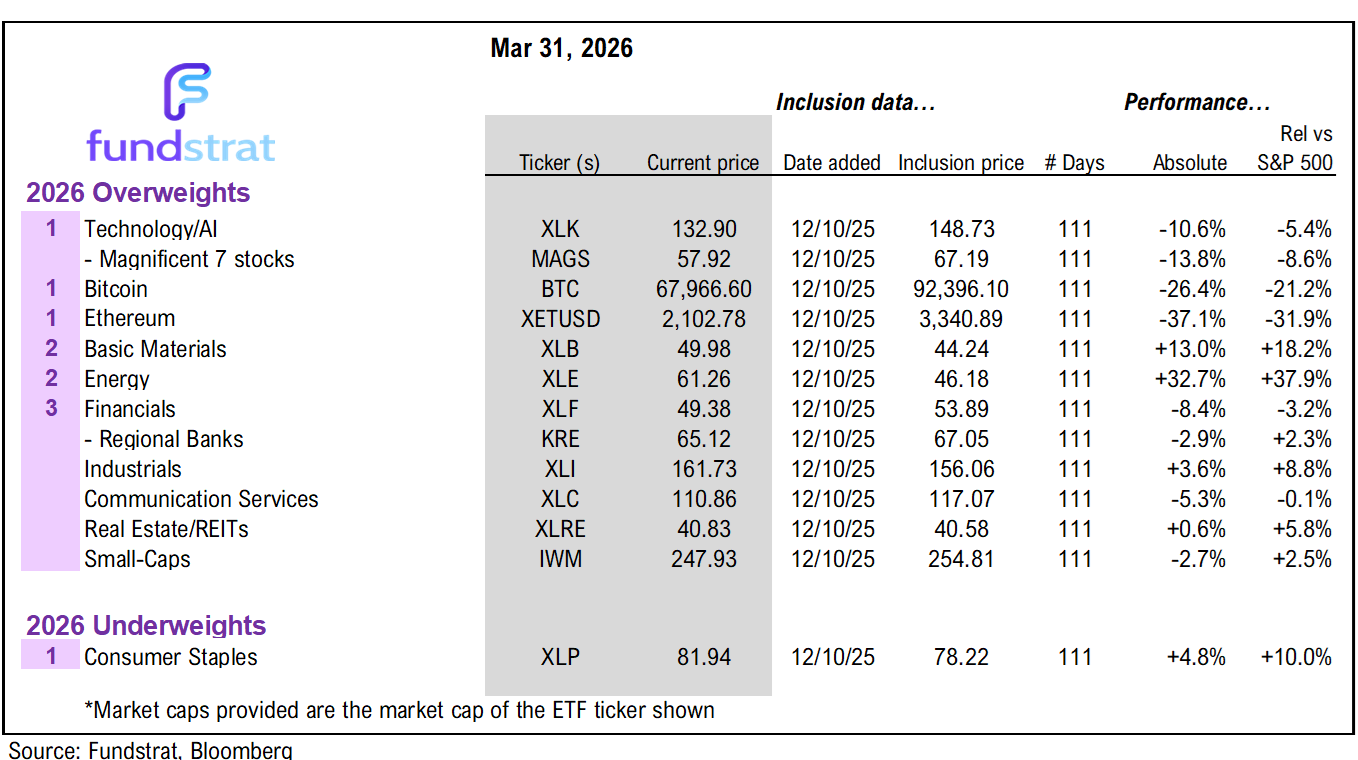
- Energy/Basic Materials -> top pick
- MAG7 & Bitcoin & Ethereum
- Industrials -> “bullet makers”
- Financials: Large-cap and regional banks
- Small-caps
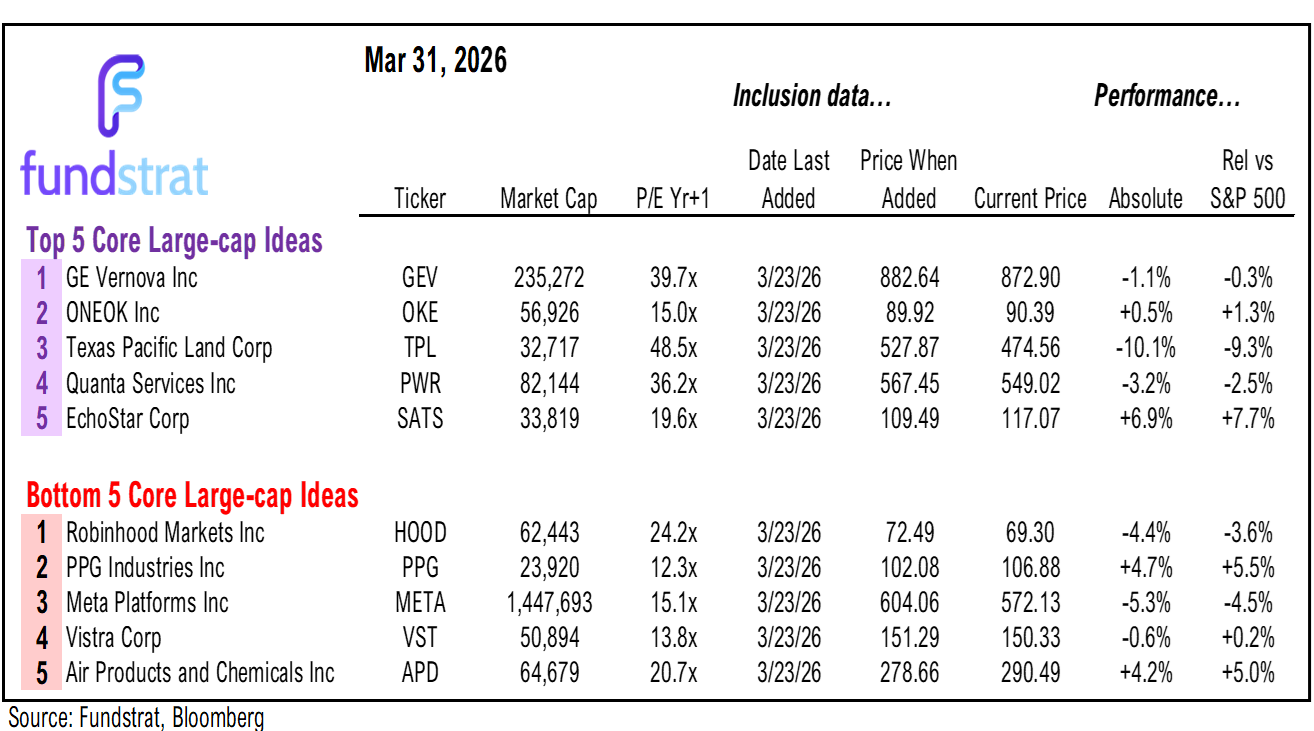
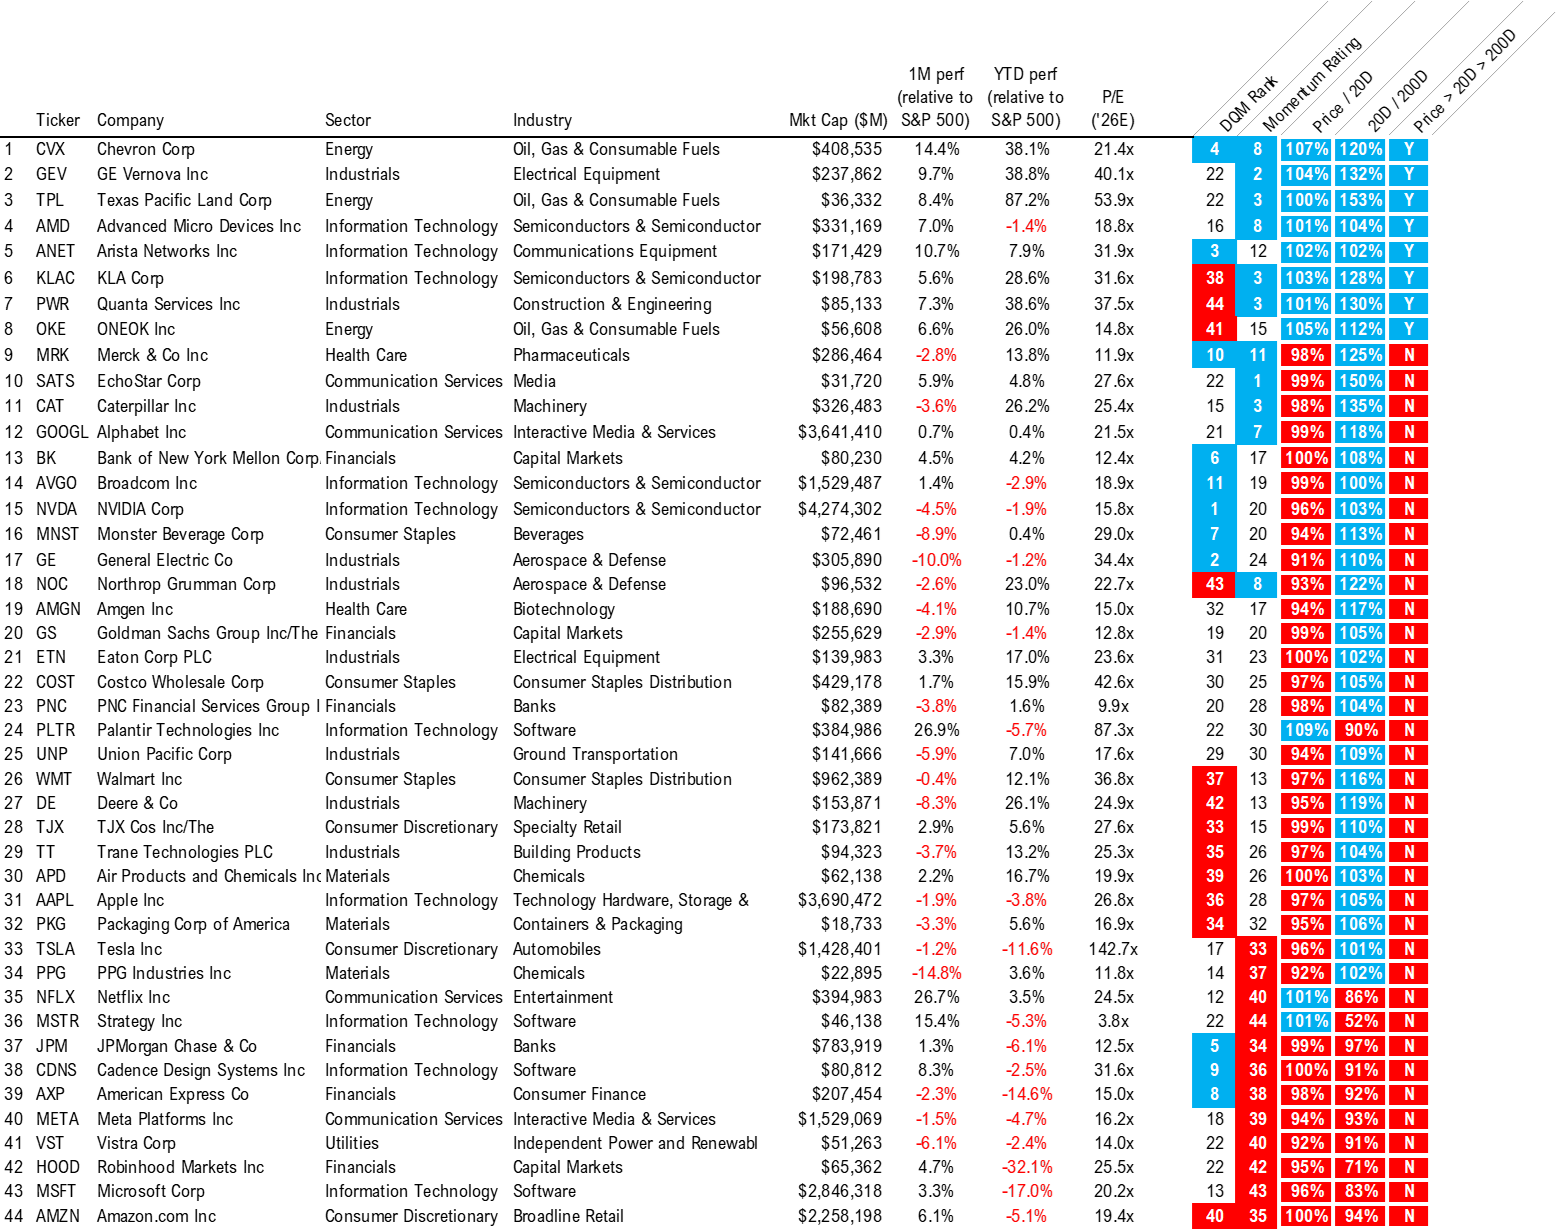
Part I: 44 Large-cap Core Ideas: Updated list is below
Large-Cap Core Stock Ideas are large-cap stocks that appear in multiple of our investment strategies.
- Consider these the stocks our top stock picks and thus, the higher quality ideas.
The Current Large-cap Core List as of 3/23/2026 is as follows:
Communication Services: GOOGL4.95% , META6.69% , NFLX3.43% , SATS4.32%
Consumer Discretionary: AMZN3.38% , TJX2.51% , TSLA4.59%
Consumer Staples: COST-0.02% , MNST1.60% , WMT0.63%
Energy: CVX-1.81% , OKE-2.76% , TPL1.54%
Financials: AXP1.68% , BK3.00% , GS4.75% , HOOD6.48% , JPM3.66% , PNC3.19%
Health Care: AMGN0.82% , MRK1.85%
Industrials: CAT6.15% , DE1.40% , ETN4.12% , GE3.85% , GEV6.93% , NOC1.59% , PWR2.86% , TT3.17% , UNP1.42%
Information Technology: AAPL2.66% , AMD3.52% , ANET5.73% , AVGO5.45% , CDNS2.60% , KLAC6.50% , MSFT2.99% , MSTR2.59% , NVDA5.58% , PLTR6.48%
Materials: APD-0.37% , PKG1.52% , PPG2.95%
Utilities: VST1.89%
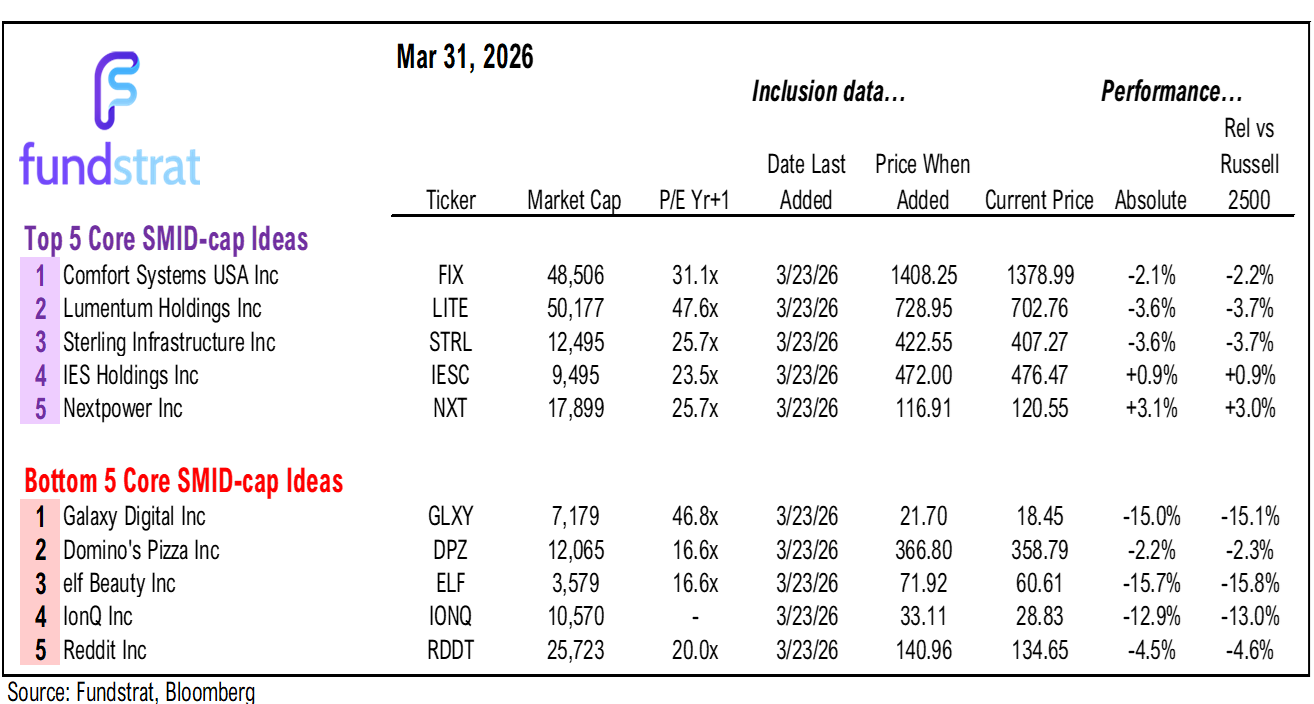
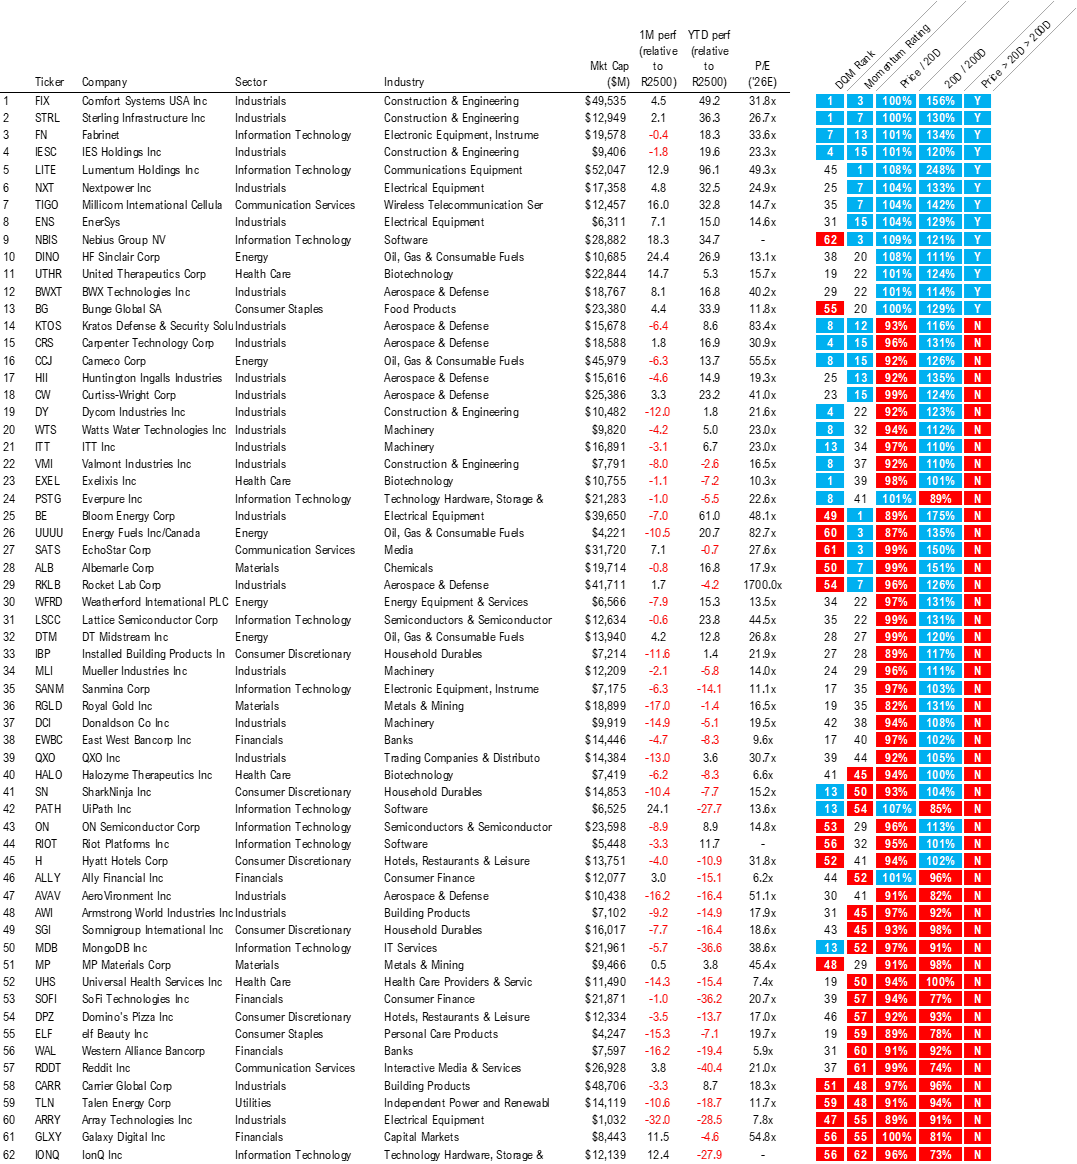
Part II: 62 SMID Core Ideas: Updated list is below
SMID Core Ideas are small and mid-cap stocks that appear in multiple of our investment strategies.
- We believe SMID Core List could benefit from the multiple themes and secular tailwinds.
The Current SMID Core List as of 3/23/2026 is as follows:
Communication Services: RDDT8.47% , SATS4.32% , TIGO2.48%
Consumer Discretionary: DPZ1.66% , H2.74% , IBP2.95% , SGI7.42% , SN8.48%
Consumer Staples: BG0.73% , ELF2.12%
Energy: CCJ5.61% , DINO-1.05% , DTM-0.03% , UUUU11.16% , WFRD2.12%
Financials: ALLY3.48% , EWBC2.84% , GLXY6.36% , SOFI4.69% , WAL4.24%
Health Care: EXEL2.24% , HALO4.02% , UHS-1.72% , UTHR0.79%
Industrials: ARRY5.09% , AVAV3.41% , AWI3.17% , BE13.37% , BWXT6.48% , CARR3.59% , CRS6.32% , CW7.76% , DCI2.74% , DY4.34% , ENS4.09% , FIX8.31% , HII2.93% , IESC7.87% , ITT5.25% , KTOS8.04% , MLI2.70% , NXT7.15% , QXO6.64% , RKLB11.62% , STRL6.78% , VMI4.05% , WTS2.29%
Information Technology: FN6.03% , IONQ8.12% , LSCC8.72% , LITE7.52% , MDB4.15% , NBIS12.45% , ON10.89% , PATH2.12% , PSTG3.60% , RIOT4.48% , SANM4.52%
Materials: ALB1.30% , MP5.72% , RGLD6.59%
Utilities: TLN1.98%
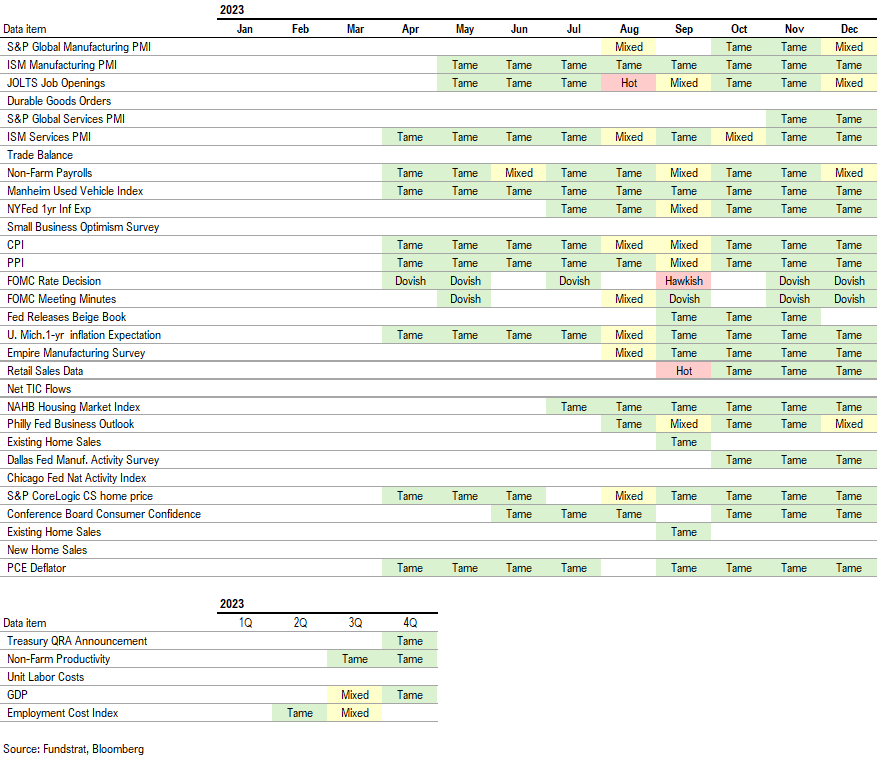
Key Incoming Data March:
3/2 9:45 AM ET: Feb F S&P Global Manufacturing PMITame3/2 10:00 AM ET: Feb ISM Manufacturing PMITame3/4 9:45 AM ET: Feb F S&P Global Services PMITame3/4 10:00 AM ET: Feb ISM Services PMIHot3/4 2:00 PM ET: Fed Releases Beige BookTame3/5 8:30 AM ET: 4Q P Unit Labor CostsTame3/5 8:30 AM ET: 4Q P Nonfarm Productivity QoQTame3/6 8:30 AM ET: Feb Non-farm PayrollsMixed3/6 8:30 AM ET: Jan Retail SalesTame3/9 11:00 AM ET: Feb NYFed 1yr Inf ExpTame3/10 6:00 AM ET: Feb Small Business Optimism SurveyTame3/10 10:00 AM ET: Feb Existing Home SalesTame3/11 8:30 AM ET: Feb Core CPI MoMTame3/12 8:30 AM ET: Jan Trade BalanceTame3/13 8:30 AM ET: 4Q S GDP QoQMixed3/13 8:30 AM ET: Jan P Durable Goods Orders MoMTame3/13 8:30 AM ET: Jan Core PCE MoMTame3/13 10:00 AM ET: Jan JOLTS Job OpeningsTame3/13 10:00 AM ET: Mar P U. Mich. 1yr Inf ExpTame3/16 8:30 AM ET: Mar Empire Manufacturing SurveyTame3/16 10:00 AM ET: Mar NAHB Housing Market IndexTame3/18 8:30 AM ET: Feb Core PPI MoMMixed3/18 10:00 AM ET: Jan F Durable Goods Orders MoMTame3/18 2:00 PM ET: Mar FOMC DecisionMixed3/18 4:00 PM ET: Jan Net TIC FlowsTame3/19 8:30 AM ET: Mar Philly Fed Business OutlookTame3/19 10:00 AM ET: Jan New Home SalesTame3/23 8:30 AM ET: Feb Chicago Fed Nat Activity IndexTame3/24 8:30 AM ET: 4Q F Unit Labor CostsTame3/24 8:30 AM ET: 4Q F Nonfarm Productivity QoQTame3/24 9:45 AM ET: Mar P S&P Global Services PMITame3/24 9:45 AM ET: Mar P S&P Global Manufacturing PMITame3/24 10:00 AM ET: Mar Richmond Fed Manufacturing SurveyTame3/26 11:00 AM ET: Mar Kansas City Fed Manufacturing SurveyTame3/27 10:00 AM ET: Mar F U. Mich. 1yr Inf ExpTame3/30 10:30 AM ET: Mar Dallas Fed Manuf. Activity SurveyTame3/31 9:00 AM ET: Jan S&P Cotality CS 20-City MoM SATame3/31 10:00 AM ET: Feb JOLTS Job OpeningsTame3/31 10:00 AM ET: Mar Conference Board Consumer ConfidenceTame
Key Incoming Data April:
- 4/1 8:30 AM ET: Feb Retail Sales
- 4/1 9:45 AM ET: Mar F S&P Global Manufacturing PMI
- 4/1 10:00 AM ET: Mar ISM Manufacturing PMI
- 4/2 8:30 AM ET: Feb Trade Balance
- 4/3 8:30 AM ET: Mar Non-farm Payrolls
- 4/3 9:45 AM ET: Mar F S&P Global Services PMI
- 4/6 10:00 AM ET: Mar ISM Services PMI
- 4/7 8:30 AM ET: Feb P Durable Goods Orders MoM
- 4/7 11:00 AM ET: Mar NYFed 1yr Inf Exp
- 4/8 2:00 PM ET: Mar FOMC Meeting Minutes
- 4/9 8:30 AM ET: 4Q T GDP QoQ
- 4/9 8:30 AM ET: Feb Core PCE MoM
- 4/10 8:30 AM ET: Mar Core CPI MoM
- 4/10 10:00 AM ET: Feb F Durable Goods Orders MoM
- 4/10 10:00 AM ET: Apr P U. Mich. 1yr Inf Exp
- 4/13 10:00 AM ET: Mar Existing Home Sales
- 4/14 6:00 AM ET: Mar Small Business Optimism Survey
- 4/14 8:30 AM ET: Mar Core PPI MoM
- 4/15 8:30 AM ET: Apr Empire Manufacturing Survey
- 4/15 10:00 AM ET: Apr NAHB Housing Market Index
- 4/15 2:00 PM ET: Fed Releases Beige Book
- 4/15 4:00 PM ET: Feb Net TIC Flows
- 4/16 8:30 AM ET: Apr Philly Fed Business Outlook
- 4/21 8:30 AM ET: Mar Retail Sales
- 4/23 8:30 AM ET: Mar Chicago Fed Nat Activity Index
- 4/23 9:45 AM ET: Apr P S&P Global Services PMI
- 4/23 9:45 AM ET: Apr P S&P Global Manufacturing PMI
- 4/23 11:00 AM ET: Apr Kansas City Fed Manufacturing Survey
- 4/24 10:00 AM ET: Apr F U. Mich. 1yr Inf Exp
- 4/27 10:30 AM ET: Apr Dallas Fed Manuf. Activity Survey
- 4/28 9:00 AM ET: Feb S&P Cotality CS 20-City MoM SA
- 4/28 10:00 AM ET: Apr Conference Board Consumer Confidence
- 4/28 10:00 AM ET: Apr Richmond Fed Manufacturing Survey
- 4/29 8:30 AM ET: Mar P Durable Goods Orders MoM
- 4/29 2:00 PM ET: Apr FOMC Decision
- 4/30 8:30 AM ET: 1Q A GDP QoQ
- 4/30 8:30 AM ET: 1Q ECI QoQ
- 4/30 8:30 AM ET: Mar Core PCE MoM
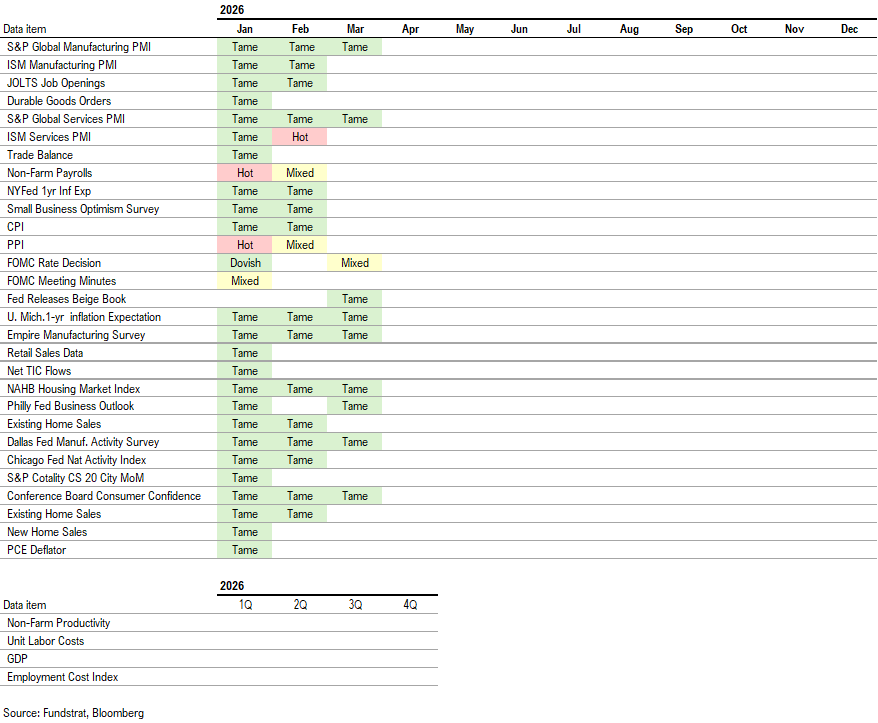
Economic Data Performance Tracker 2026:
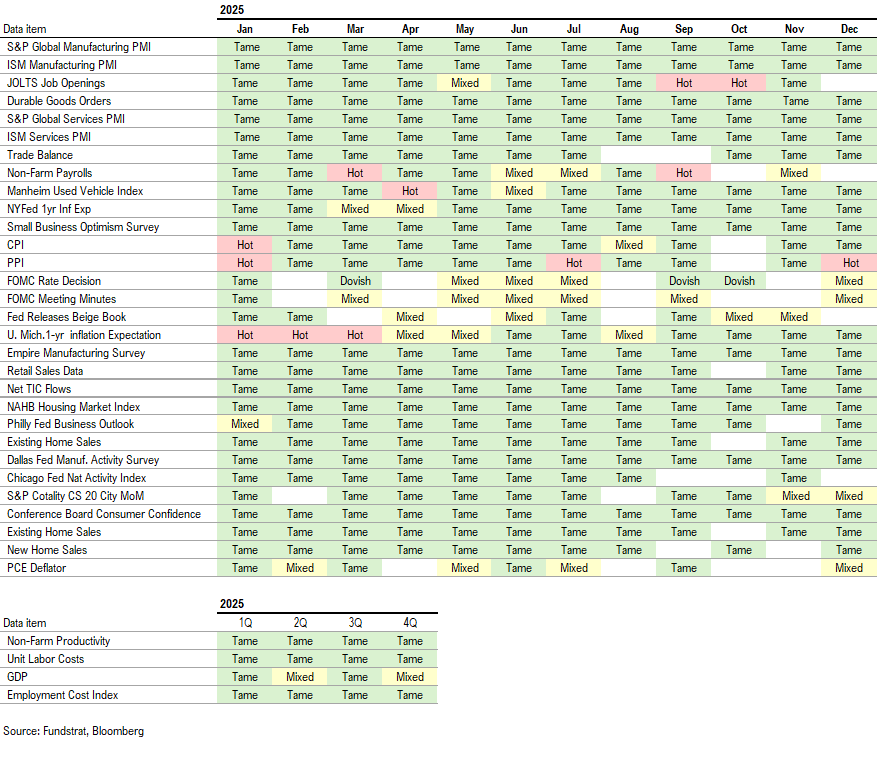
Economic Data Performance Tracker 2025:
Economic Data Performance Tracker 2024:
Economic Data Performance Tracker 2023:
To unsubscribe from this email, please click here. You can also manage your email preferences and opt out of other types of emails by clicking here.