Introduction to Mark Newton’s Technical Analysis

Mark Newton, CMT
Why is Technical Strategy Important?
Overall, utilizing technical analysis in one's process might be beneficial for the following reasons:
The following concepts can help you navigate the markets:
- First, they allow one to understand what the current trend is of the asset (stock, ETF, crypto, etc ) in question over various time frames. It's useful to know whether a stock is trending higher, lower, or sideways, and attempt to buy/own stocks with both technicals and fundamentals simultaneously improving.
- Second, technicals can be used for risk management purposes, and many investors make use of technicals to help right-size their positions, (overweighting stocks which have the best technical setup or offer attractive risk/reward profiles, particularly if this lines up with the fundamental backdrop). Moreover, others consider using technicals to hedge or sell their positions if/when a stock starts to deviate meaningfully from its trend or potentially reaches levels out of line with fundamentals.
- Third, technical analysis is often used for stock selection, in seeking out stocks which appear like attractive risk/reward candidates and which might offer above-average return possibilities. Based on one's risk tolerance or preference for investment, some might consider buying stocks which are breaking out to new 52-week high territory, or have been demonstrating superb relative strength versus their peers. Others might choose to buy short-term weakness within a current uptrend at levels which technicals suggest make sense.
When looking at technical analysis the following concepts are tied to the discipline and can help one navigate the markets:
- Momentum
- Relative Strength
- Volume
- Breadth
- Sentiment Shifts
- Cycles
- Seasonality
- Trend Analysis (Trend Following, and Counter-Trend)
- Sector Rotation
- Time Analysis
- Elliott-Wave Theory
Mark Newton’s Methodology
Important Indicators Used
Trend Identification
daily, weekly, monthly basis
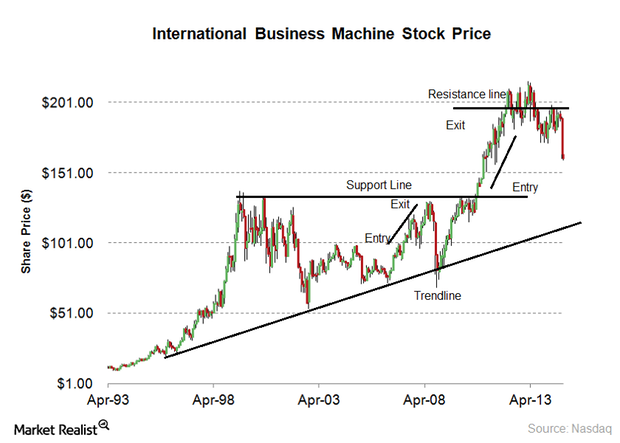
Structural Analysis
Utilizing former highs and lows as potentially being important for resistance and/or support for trading over multiple timeframes
Trendline Utilization
Drawing trendlines extending from the lowest lows to the low preceding the highest highs
Fibonacci Analysis
Using the concept of Fibonacci for retracements in both time and price terms for identifying possible areas of exhaustion
Momentum Analysis
Seeking stocks exhibiting positive momentum for long investments on multiple timeframes
Momentum Divergence Analysis
Keeping track of when momentum starts to positively or negatively diverge from current price trends for purposes of early warnings
Volume Analysis
Keeping track of heavy volume during price gains or lack thereof for help in deciphering the possible duration of a certain trend
Breadth
his is more useful for broader indices when studying the underlying health of a market, but remains quite useful
Ratio Charts
Comparing a stock to its industry and/or to underlying index such as SPX
Relative Strength
Seeking out stocks which exhibit stellar strength and are trading at or within striking distance of 52-week highs (for Long stock selection)
Counter-Trend Analysis
Utilization of Tom DeMark's indicators like TD Sequential and/or TD Combo to identify strong trends which might be on the verge of reversing course, either from downside to upside, or vice-versa
Cycles
Utilizing cycle composites to gain an understanding of the most commonly seen cycles which dictate patterns of low-to-low, or high-to-high for help in identifying potential highs and lows in price
Elliott-Wave
Elliott-Wave projections for the purposes of forecasting potential price targets and utilizing former highs or lows for various stock rallies and for purposes of identifying whether a rally is a new and impulsive trend, or represents a counter-trend move
Astro-Analysis
Utilizing Sun, moon and planetary cycles for use in pinpointing highs, lows and trends for stocks and indices, both from a transiting to transiting standpoint, or transits to natal charts for analysis
Seasonality Studies
Seasonality Studies to identify times of above–average strength and/or weakness based on historical trends
Sentiment Analysis
Using Equity Put/call ratios for indices or stocks and/or commonly used Sentiment polls for keeping tabs on investor sentiment
Introduction to Newton's Upticks
History shows Sir Isaac Newton not only to have excelled as a Mathematician and physicist, but also to be a skilled astronomer, alchemist, theologian, and author.
Many who have studied Newton’s history know that he published a book called “Opticks” back in 1704, expounding his corpuscular theory of light. He considered light to be made up of extremely subtle corpuscles, that ordinary matter was made of grosser corpuscles and speculated that through a kind of alchemical transmutation. As he puts it, "Are not gross Bodies and Light convertible into one another ... and may not Bodies receive much of their Activity from the Particles of Light which enter their Composition?"
Newton also constructed a primitive form of a frictional electrostatic generator using a glass globe. He was the first to show a diagram using a prism as a beam expander, and also the use of multiple-prism arrays.
Fast forward to October 2022, in homage to the great Isaac Newton, I am now unveiling my first technical Stock list, which on a subtle play on Newton’s Opticks, will be called “Upticks.” This will be an intermediate-term technically derived stock list of some of my favorite liquid names within various sectors of the S&P 500 which I feel might offer attractive risk/reward opportunities at this stage of the market.
These ideas are largely based on stocks at/near 52-week highs that are showing excellent technical structure and little evidence of technical deterioration. However, in some cases, I will elect to buy stocks that are extreme laggards, if my work shows that they’re primed to begin moving sharply off the lows following initial consolidation. Note, stocks of this sort are far more likely to be tactical longs than buy-and-hold positions. However, largely, this list comprises my thinking of the best stocks within most sectors of the S&P 500.
The duration for these selections will largely be 4-6 weeks and hopefully longer. I have included technical resistance as well as Support for those who wish to utilize these. Stocks that move under Support before resistance range is met will be removed from my list and not addressed in future emails. Furthermore, upside resistance is a guideline only, and 100% technically derived and not related to fundamentals of the underlying issuer. Occasionally upside resistance ranges might prove temporary only and i shall adjust if/when these resistance zone is reached if i feel that further technical upside is possible. It's up to each investor to utilize their own risk management and adhere to their own investment timeframe given their own time horizon and risk tolerance.
Methodology
- Relative strength vs sector and index
- At/near 26-week and/or 52-week highs
- Positive momentum and/or Upward sloping moving averages on multiple timeframes
- Lack of DeMark exhaustion on daily, weekly, monthly and/or in combination based on TD Sequential and/or TD Combo indicators
- DeMark “TD 13 countdown Buys” utilizing TD Sequential and/or TD Combo indicators at/near lows on multiple timeframes
- Elliott-wave theory
- Lack of deterioration within its sector and at/near upper quartile of its annual range
- Above-average bullish bases for lengthy timeframes which might precede technical breakouts
- Short-term downtrends within existing intermediate-term uptrends which provide attractive risk/reward opportunities
- Leading stocks within sectors poised to benefit from cyclical upturns